Spatial Patterns and Contributing Factors of Public Bicycle Station Locations in Seoul : A Comparative Analysis (2016-2021)
 ; Jun, Hee-Jung***
Abstract
This paper analyzes the changes in the spatial patterns and contributing factors of Seoul’s public bicycle station locations (i.e., Ddareungi) in 2016 and 2021. This study conducted Moran's I and LISA analyses, as well as spatial regression analysis, using the data collected from the Seoul Open Data Plaza for 2016 and 2021. The results revealed the following: First, although the locations of Ddareungi stations were unevenly distributed throughout Seoul in both 2016 and 2021, the spatial clusters of Ddareungi stations in 2021 were smaller and more widely distributed across the administrative districts compared to those in 2016. Second, most bike equity indicator values did not have a statistically significant impact, indicating a lack of consideration for the accessibility of socially vulnerable individuals during the location selection of Ddareungi stations. Third, a greater number of stations were installed in administrative districts with a higher proportion of bus stops and subway stations, suggesting improved accessibility to public transportation in 2021 compared with 2016. Based on these findings, this paper concludes that the selection of Ddareungi station locations has not adequately considered transportation equity and emphasizes the need for policy criteria that incorporate transportation equity considerations at a macro level.
Keywords:
Public Bicycle, Bicycle Station, Transportation Equity, Spatial Econometrics키워드:
공공자전거, 공공자전거 대여소, 교통형평성, 공간계량분석Ⅰ. Introduction
Since declaring itself as the 'Sharing City' in 2012, the Seoul Metropolitan Government has been implementing various policies and initiatives to establish a foundation for sharing-based infrastructure. One of the most representative projects is the 'Seoul Bike Ddareungi' bicycle sharing system (hereafter Ddareungi). Particularly after the COVID-19 pandemic, interest in and demand for Ddareungi have surged as an alternative to public transportation as it can be used without having to be near large groups of random people (Kim et al., 2021; Korea Consumer Agency, 2018). The usage data of Ddareungi reflects this trend. When first introduced in 2015, there were approximately 110,000 rental transactions which increased rapidly, reaching about 1.61 million in 2016, 5.14 million in 2017, 11.67 million in 2018, and 24.21 million in 2019. Notably, during the COVID-19 period in 2020, the total number of Ddareungi usage increased by 46% year-over-year to 35.37 million. As of June 2024, the most recent data indicates that the cumulative number of Ddareungi users was more than 4.55 million, meaning that one out of two Seoul citizens uses Ddareungi.
Ddareungi is a transportation service that allows users to pay only for the amount of time they use a shared bicycle. It operates as a station-based system throughout Seoul, requiring users to rent and return bicycles at designated docking stations. This system ensures efficient management and optimal use of bicycles. On the other hand, an emerging trend in public bicycle services is a dockless system, which allows users to freely rent and return bicycles at any locations they want without a designated station. While maximizing user convenience, it has the drawback that bicycles may be left disorderly. For this reason, Ddareungi is still operated as a station-based system.
Transportation services are closely related to people's daily activities, and their influence has a huge ripple effect throughout the city (Korea Planning Association, 2016). Accordingly, issues of spatial exclusion arise depending on the location and accessibility of transportation services (Church et al., 2000), leading to the concept of transportation equity (Levinson, 2010; Litman, 2003). Public bicycles, such as Ddareungi, are drawing attention as a means of increasing transportation equity by connecting the first and last miles between public transportation hubs and destinations. In fact, in response to the large transportation disparity between the Southern and Northern regions in Seoul (Gangnam and Gangbuk), the Seoul Metropolitan Government published the 'Seoul Metropolitan Government Regional Balanced Development Plan (2022-2026),' which includes expanding Ddareungi stations to resolve this disparity.
Previous studies on Ddareungi and public bicycle locations have focused on optimizing their locations based on demand. However, since public bicycles are a government-provided public service, not only demand but also equity must be considered in determining their locations (Dear, 1974; Yun and Lee, 2008). Recent studies have introduced the concept of 'Bike Equity' and developed and presented measurement indicators (Bhuyan et al., 2019; Prelog, 2015; Zuo et al., 2020), but related research is still insufficient.
To fill the gap in the literature, this study asks the following research question by focusing on Seoul, a city with an active public bicycle policy and significant regional disparities. "How have the locations of the public bicycle Ddareungi rental stations in Seoul changed compared to the early stage of the policy?" Accordingly, the temporal scope of the study was set to 2016, when the Ddareungi policy was fully introduced, and 2021, the last year when the standards for installing Ddareungi rental stations were announced. The spatial unit of analysis is the administrative district level, Dong, the smallest unit for policy design. The boundaries of administrative Dongs in Seoul have changed over the years, and to reflect the changes, 424 administrative Dongs were set as the research subjects in 2016, and 426 administrative Dongs were set as the research subjects in 2021. The analysis employs spatial dependence concepts and spatial analysis methodologies, and based on the analytical results, this study derives policy implications for enhancing transportation equity in public bicycles and shared mobility systems like Ddareungi.
Ⅱ. Literature Review
1. Location of Public Facilities
The term "location" refers to "a suitable place or area selected for human economic activity." Therefore, the location of a public bicycle can be defined as "an area selected as being suitable for the position of a public bicycle rental station." As a public good used by many citizens, public bicycles possess characteristics of non-excludability and non-rivalry, and are generally proposed and implemented in the public domain. In addition, the public bicycle rental stations required for rental and return can be considered public facilities.
According to public goods theory, the location of public facilities is determined based on maximizing user benefits (Tiebout, 1956). Previous studies have focused on the factors influencing public bicycle demand, assuming that placing rental stations in high-demand areas will maximize user benefits. Public transportation factors and local characteristics are considered as the main contributing factors.
First, public transportation factors include buses and subways. Previous studies have shown that the demand for public bicycles increases when there are nearby bus stops or subway stations (Kang and Jeong, 2019; Kim et al., 2020; Do and Noh, 2014; Sa and Lee, 2018; Ahn and Yi, 2022; Jang et al., 2016). Next, local characteristics include population, area size, and land use. Population and area size are sometimes combined into population density, while studies may consider either resident population or daily floating population. Regarding land use, research has shown that public bicycles are more actively used when the land around a public bicycle station is for mixed-use or for residential or commercial use (Sa and Lee, 2018; Ahn and Yi, 2022; Jang, et al., 2016; Moudon et al., 2005).
In this way, public bicycle use is closely related to the location of public bicycle stations. If the distance between the stations is too far, public bicycle usage becomes inconvenient and restricted. This indicates that the locations of public bicycle stations should be determined in consideration of the distance between the stations, rather than being randomly distributed. In this context, public bicycle use and station location may be considered as having spatial dependence,1) suggesting a high correlation between adjacent areas. Accordingly, the studies by Lee et al. (2014), and Ahn and Yi (2022) confirm that there is spatial dependence in public bicycle use, and examined the factors influencing public bicycle usage in Changwon and Daejeon, respectively, applying the spatial econometrics methodology.
Meanwhile, since public bicycles embody the public nature, the location of public bicycle stations — which can be considered public facilities — should not be determined solely based on the demand (Dear, 1974; Teitz, 1968). In addition, the 'user benefits' emphasized in the public goods theory also must be extended to socially excluded groups. Therefore, rather than focusing only on the usage and demand of general users, it is necessary to consider equity in locating public bicycles stations.
2. Public Bicycle Station Location and Equity
While equality refers to treating everyone equally without bias to either side, it is a concept that combines horizontal equity, which means treating equal things equally, and vertical equity, which means treating unequal things unequally (Levinson, 2010).
Discussions on equity are closely linked to the concept of social exclusion. Social exclusion occurs when an individual residing in a certain area is completely or partially excluded from social, economic, and cultural networks and facilities, thus preventing one from participating in normal activities as a community member (Burchardt et al., 1999). In particular, Church et al. (2000) suggested representative types of transportation-related social exclusion such as exclusion from facilities, economic exclusion, and space exclusion. Exclusion from facilities refers to restrictions on access to essential facilities for daily activities (e.g., shopping centers, schools, medical facilities, and recreational facilities) due to an increase in the spatial distance between these facilities and residential areas. Economic exclusion is related to restrictions on access to employment opportunities due to an increase in financial and temporal costs of mobility, which in turn lead to a decrease in income. Spatial exclusion occurs when urban planning strategies for safety or space management unintentionally restrict socially marginalized groups from using transportation facilities (Church et al., 2000).
Shared mobilities such as public bicycles are drawing attention as a means of alleviating the social exclusion problem of traditional transportation services and improving transportation equity (Shaheen et al., 2017). Public bicycles allow users to freely set their travel routes based on their needs, effectively bridging first- and last-mile gaps. By improving access to various facilities including public transportation, they help address exclusion from facilities. Accordingly, they have the effect of improving vertical equity according to travel ability for groups such as students, those without a driver's license, and those without private vehicles. In addition, since users can ride only as much as they pay for without owning a means of transportation, shared mobilities can reduce the cost of actually purchasing, maintaining, and repairing mobility and the time spent finding parking spaces. This can mitigate economic exclusion by reducing the financial and temporal burdens associated with the transportation process, thereby contributing to the improvement of vertical equity associated with income and social class.
Previous studies have suggested two approaches to the equity of public bicycle station locations (Bhuyan et al., 2019; Chen et al., 2019; Prelog, 2015; Zuo et al., 2020). The first approach focuses on providing services for socioeconomically disadvantaged groups and promoting their participation in decision-making. This approach measures how easily marginalized groups can access public bicycle stations using the Bike Equity Index (BEI). The BEI considers factors such as the proportion of those below the poverty level in the area, minorities-who are non-mainstream ethnic groups in the society and students, young people, the elderly, and households without private cars who have no choice but to rely on public transportation. These groups are directly linked to the above-described vertical equity.
The second approach focuses on the equal spatial distribution of infrastructure. Therefore, equity is measured by examining how the locations of public bicycle stations are actually distributed or by examining the relationship between BEI and station locations. Instead of focusing on individuals, this approach addresses equity at the local level, which is particularly relevant since local governments often oversee public bicycle programs. Previous studies applying this approach have visualized the spatial distribution of public bicycle stations by mapping, identifying where the public bicycle stations are located or in which areas the public bicycle stations are concentrated.
3. Spatial Disparities in Transportation2)
One of the major causes of spatial exclusion in transportation services is the spatial disparity in infrastructure supply. These spatial disparities can occur between different regions as well as between areas within a region (Korea Planning Association, 2009). In Korea, one of the most representative disparities is the gap between Gangnam and Gangbuk - the Southern and Northern regions in Seoul. Policies from the late 1960s to the 1990s focusing on limiting development in Gangbuk while promoting concentrated development in Gangnam resulted in income disparities (Lee and Choi, 2010; Youn and Lim, 2012). These policies also contributed to broader spatial inequalities (Kim and Jun, 2020; Kim and Lee, 2004; Lee and Seo, 2009; Lee et al., 2018), and the transportation sector has not been an exception.
Many previous studies have empirically revealed the transportation disparities within Seoul. Kim and Lee (2004) showed that more people own cars in Gangnam than in Gangbuk, and Lee and Seo (2009) confirmed that this gap between Gangnam and Gangbuk had not narrowed over time. Lee et al. (2012) compared the correlation between bus and subway accessibility and income throughout Seoul, and suggested that public transportation accessibility in the Northeastern zone needs to be improved compared to the central and southeastern zones. Lee et al. (2017) analyzed public transport accessibility for vulnerable groups (low-income individuals, the elderly, and teenagers), and found that most of the vulnerable areas were concentrated in Gangbuk region, including Seongbuk-gu, Gangbuk-gu, Yangcheon-gu, and Eunpyeong-gu. As such, the transportation disparity in Seoul extends beyond the simple disparity between Gangnam and Gangbuk, revealing significant differences by zones.
Realizing the severity of these transportation disparities, the Seoul Metropolitan Government implemented policy measures to address regional imbalances. In August 2018, the government converted four planned railway projects in Gangbuk into government-funded projects to enhance transportation convenience in the northern region. Later, in November 2022, it announced the 'Seoul Metropolitan Government Areal Balanced Development Plan (2022-2026)', which aimed to expand urban railway services, particularly in the Southwest and Northeast Regions. In addition, the government sought to improve public transport accessibility by building last-mile mobility infrastructure. As part of this effort, the city prioritized expanding public bicycle stations in areas where the number of stations was below the citywide average, such as Gangbuk-gu and Dobong-gu.
4. Public Bicycle System 'Ddareungi'
Recently, as interest in non-motorized, carbon-free green transportation has increased and concerns over urban traffic have become more serious, the Seoul Metropolitan Government has sought to shift the paradigm of urban transportation policy from car-centered transportation to person-centered transportation. To establish bicycles as a daily mode of transportation and create an environment where anyone can use bicycles conveniently and safely, it introduced the public bicycle Ddareungi policy.
The Ddareungi policy was officially launched in 2016, following the pilot projects operated in Yeouido and Sinchon in 2015. Based on the challenges found in the pilot projects, the Seoul Metropolitan Government announced the '2016 Public Bicycle Station Selection Plan', outlining the procedures and criteria for station installation. The installation process involved 'preliminary investigation → candidate site selection → on-site inspection → final selection.' In selecting the candidate sites, 23 evaluation items are reviewed, including basic conditions (type of facility, distance from public transportation, etc.), areal characteristics (slope, density of stores, pedestrian and traffic volume, etc.), and bicycle roads (accessibility to bicycle roads, etc.). For the final selection, the survey results from annual pass members and citizen complaints submitted through the official website were considered. The installation criteria consist of 'setting an expanded area in consideration of the connection with the existing station installation areas, calculating the size of the stations (including the stands) by autonomous district, installing in areas near major facilities that generate traffic, securing installation positions to minimize violation of pedestrian rights, selecting locations in consideration of conflicts with pedestrians and vehicles, and selecting locations with available power supply.'
Most recently, in 2021, the Seoul Metropolitan Government revised and streamlined these guidelines, publishing '2021 Seoul Bicycle Utilization Facility Installation and Management Guidelines.' The procedure consists of 'submission of selected candidate site → on-site inspection → installation plan notification → final decision on installation → station installation,' and opinions from citizens, such as complaints, are collected for 14 days in the installation plan notification step. The updated installation criteria included ensuring the absence of pedestrian impediment, securing space to minimize the investment of related budget and time, and the absence of conflicts with existing facilities such as bus stops, crosswalks, building entrances, and braille blocks so as not to impede the use of such facilities.
Comparing the Ddareungi station installation criteria and procedures between 2016 and 2021, a key difference between 2016 and 2021 was the simplification of installation criteria. In 2016, six major installation criteria were considered, while in 2021, only two installation criteria were presented: securing space and the absence of conflicts with existing facilities. However, despite the policy's maturity, these criteria still prioritized the efficiency of project implementation over consideration for equity.
Another significant change was the expansion of public participation in the process. In 2016, only the opinions of a limited number of citizens, such as annual pass members, were considered, but in 2021, the process was opened to all citizens. This increased participation likely enhanced the participation of socioeconomically disadvantaged groups in decision-making. Accordingly, it can be seen that consideration of transportation equity has improved compared to the early stage of the Ddareungi policy.
5. Research Distinctiveness
Despite the quantitative expansion and qualitative improvement of public bicycle policies, research on the station location change patterns and their social effects is still insufficient. Most previous studies on public bicycles and Ddareungi stations (e.g., Kang and Jeong, 2019; Kim et al., 2020; Do and Noh, 2014; Sa and Lee, 2018; Ahn and Yi, 2022; Jang et al., 2016) have primarily focused on rental and return patterns, emphasizing usage rates and demand. While demand analysis is one approach to selecting the optimal locations, Ddareungi stations are public facilities and should not be placed solely based on demand. Therefore, this study discusses the social exclusion issues of Ddareungi by examining the spatial distribution and location determinants of the Ddareungi stations and explores solutions to mitigate them.
Existing studies on the equity of public bicycle locations (e.g., Bhuyan et al., 2019; Chen et al., 2019; Prelog, 2015; Zuo et al., 2020) are based on single-year analyses. However, the Ddareungi policy has undergone significant changes as the policy matured not only in the quantity of stations but also in the station installation criteria and procedures. Single-year analyses may fail to capture the quantitative expansion and qualitative improvement of the policy. Therefore, this study sets the research question: 'How have the locations of public bicycle Ddareungi stations in Seoul changed compared to the early stage of the policy introduction?'. More specifically, it compares the location pattern of the Ddareungi stations in 2021, which was five years after the introduction of the policy, with the aim of examining the improvement of the Ddareungi policy. Through a multidimensional manner, this study aims to address the equity of the Ddareungi locations by examining how the spatial distribution and clustering of them have changed, and how the relationship between station locations and the Bike Equity Index (BEI) has changed over time.
Ⅲ. Research Design
1. Research Scope and Variable Selection
This study aims to address the location of Ddareungi stations at the administrative Dong (hereafter Dong) level. According to the above-mentioned '2016 Public Bicycle Station Selection Plan' and the '2021 Seoul Bicycle Utilization Facility Installation and Management Guidelines,' the installation and management of Ddareungi stations are carried out at the autonomous district (administrative Gu) level. However, the average bicycle usage distance is generally about 3 km (Lee and Leem, 2010), and the average Ddareungi usage distance is known to be longer (4.8 km) (Kim et al., 2021). The average area of an autonomous Gu in Seoul is 24.21 km2, which is more than five times the average bicycle and Ddareungi usage distance. This creates limitations in setting the spatial unit as an autonomous district. To address these limitations, this study analyzes the Dong, which is an administrative unit smaller than an autonomous Gu. The average area of a Dong in Seoul is 1.425 km2, making it more suitable for analyzing Ddareungi movements. It is expected that Ddareungi users primarily travel between stations within a Dong, or between stations on the border between two or three adjacent Dongs. Based on this, this study assumes that the spatial unit where Ddareungi station locations can have spatial dependence is Dongs; thus, they are set as the primary unit of analysis.
This study aims to determine how the location of Ddareungi has changed over time as the policy has matured. The temporal scope covers 2016, when the Ddareungi policy began in a full scale, to 2021, the most recent date when the Ddareungi station installation guidelines were announced. Although the Ddareungi policy began in 2015, this year was excluded because at that time, it was a pilot project mainly in Yeouido and Sinchon. In addition, since no new Ddareungi installation and management guidelines have been announced since 2021, it is difficult to verify further policy change; therefore, the years thereafter were also excluded. However, since the boundaries of Seoul's Dongs have changed over time,3) this study reflects this change and analyzed 424 Dongs from 2016 to 2019, 425 in 2020, and 426 in 2021.
The dependent variable of this study is the number of Ddareungi stations in the Dongs in 2016 and 2021. The independent variables include the five factors of the Bike Equity Index (BEI) presented in previous studies and the public transportation factor. First, since the BEI consists of various groups of disadvantaged classes, it was assumed that this index could measure the impact of public bicycles on vertical equity. Accordingly, each indicator has been adjusted to reflect the South Korean context. The existing BEI was modified as follows: by modifying the poverty class into basic livelihood security recipients, foreigners into foreigners residing in Seoul, the elderly as the population aged 65 or older, young people as the population aged 15 to 29,4) and households without private cars as individuals without private cars.5) Each index was constructed by calculating the proportion (%) of each group in the resident registration population based on the Dong, which is the analytical unit of the present study. Next, the public transportation factor was included because it is closely related to the function of public bicycles and contributes to mobility improvement and transportation equity. The number of bus stops and subway stations6) located in each Dong was calculated to derive the public transportation factor. Additionally, control variables include factors identified in previous studies as determinants of the location of public bicycles, such as total population per Dong, area (km2), and number of businesses.
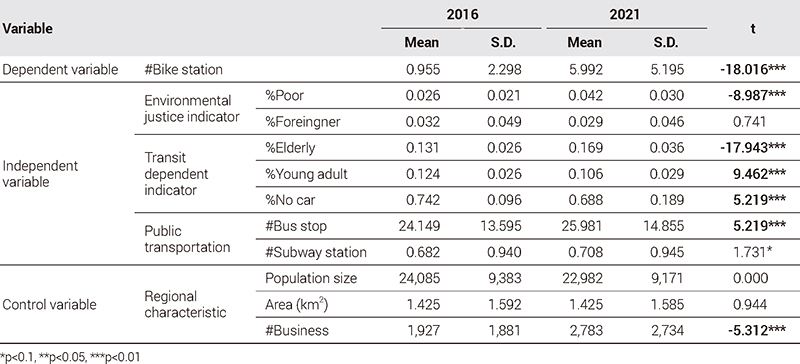
Data for all variables used in this study was obtained from the 'Seoul Open Data Plaza.' In addition, data for each variable in 2016 and 2021 was acquired for comparison by year. ArcGIS and Stata were employed to construct variables. <Table 1> shows the descriptive statistics for each variable. First, in the case of the dependent variable, the number of Ddareungi stations in one Dong increased by more than six times in 2021 compared to 2016, and the t-test results showed that this change was significant. In the case of the independent variables, BEI, the percentage of basic livelihood security recipients and the percentage of elderly population increased, while the percentage of foreigners, the percentage of young people, and the percentage of individuals without private cars decreased. The t-test results showed that the differences in all BEI indicators except for the percentage of foreigners between 2016 and 2021 were statistically significant. Another independent variable, public transportation factors, showed a significant difference between 2016 and 2021, and it was observed that the number of bus stops and subway stations in one Dong increased. The areal characteristics factors, which are control variables, showed no statistically significant differences in the t-test results except for the number of businesses.

Descriptive statistics
2. Analytic Methods and Procedures
This study analyzed the spatial distribution and determining factors of the location of the Ddareungi stations using spatial analysis methodology. Spatial analysis is generally divided into exploratory spatial data analysis and confirmatory spatial data analysis. First, as part of exploratory spatial data analysis, this study examined whether Ddareungi stations form clusters and where such clusters are distributed. The spatial distribution of the Ddareungi stations was visualized using map representations, and Moran’s I analysis was performed to investigate the presence of spatial dependence among the Ddareungi stations. This is an analytic method that assesses global spatial dependence through Moran’s I index, which has a value between -1 and 1 derived from a spatial matrix.7) The closer the value is to 1, the more adjacent areas with similar values are, and the greater the clustering effect (Lee and Shim, 2011). In the context of this study, if Dongs with many Ddareungi stations or Dongs with a small number of Ddareungi stations are clustered together, this means that Ddareungi stations are not evenly distributed across areas.
Following the global spatial dependence analysis, this study conducted the Local Indicator of Spatial Association (LISA) analysis to identify local spatial dependence. While Moran’s I analysis can confirm the presence of overall spatial dependence, the LISA analysis determines the specific areas where spatial dependence is exhibited. In the LISA analysis, spatial clusters are classified into four types: H-H (High-High), L-L (Low-Low), H-L (High-Low), and L-H (Low-High). H-H is an area where high values are located around high values, L-L is an area where low values are located around low values, L-H is an area where high values are located around low values, and H-L is an area where low values are located around high values. A higher concentration of H-H or L-L clusters corresponds to a higher Moran’s I value (Anselin, 1995). The results of the LISA analysis can be visualized through LISA Cluster Mapping, which highlights areas with statistically significant spatial correlations In these visualizations, H-H is marked in dark red, L-L in dark blue, L-H in light blue, and H-L in light red. Applied to this study, areas where Dongs with a high number of Ddareungi stations are clustered together were colored dark red (H-H), while areas where Dongs with few Ddareungi stations are clustered together were colored dark blue (L-L).
In the confirmatory spatial information analysis, this study identified factors affecting the number of Ddareungi stations through a spatial regression analysis. When spatial data is at the areal level, statistically significant spatial dependence can violate the fundamental assumptions of ordinary regression models. In such cases, a spatial regression model capable of controlling areal characteristics is required (Lee and Shim, 2011). Representative examples include the Spatial Lag Model (SLM), which directly reflects spatial dependence in the model, and the Spatial Error Model (SEM), which reflects the spatial dependence of errors in the model. To determine the most suitable model, the statistical significance of LM-Lag and LM-Error is assessed. If a spatial regression model was deemed appropriate, statistical significance of Robust LM-Lag and Robust LM-Error tests is then compared to decide whether SLM or SEM was the better fit. In addition, the goodness-of-fit and explanatory power of the models were evaluated using R2 and Log likelihood values, where higher values suggest a better model, and the Akaike Information Criterion (AIC) and Schwarz Criterion (SC), where lower values also indicate a better fit. When SLM or SEM exhibited higher R² and log-likelihood values and lower AIC and SC values compared to the Ordinary Least Squares (OLS) regression model, it was determined that the spatial regression model provided a more accurate and robust explanation of Ddareungi station distribution (Anselin, 1995).
IV. Analytical Results
1. Spatial Distribution of Ddareungi Stations
<Figure 1> and <Figure 2> illustrate the distribution of Ddareungi stations and the quartile map of the number of stations in 2016 and 2021. The Ddareungi policy started with 130 stations in 2015, and 275 new Ddareungi stations were formed until 2016; thus, the total number of the stations was 405 across Seoul. Most of the stations were located in the Central zone, the Northwest zone, and the southern part of the Northeast zone. The areas with a particularly high number of Ddareungi stations were Yeouido and Sangam areas, which were developed around the finance and investment industries and the media and ICT industries, respectively. These areas also have a large floating population of young people, which likely contributed to the high demand for public bicycles.

2016 Bike station distribution and quantile maps

2021 Bike station distribution and quantile maps
Although the number of Ddareungi stations almost tripled compared to the pilot project, 286 Dongs still did not have a single station. These Dongs are mainly located in the Southeast zone, the southern part of the Southwest zone, and the northern part of the Northeast zone. This highlights significant regional disparities in Ddareungi station distribution in 2016. Previous studies on the transportation gap in Seoul indicate that the Gangnam area enjoys a higher level of transportation service—both through private vehicles and public transportation—compared to the Gangbuk area. However, the findings of this study confirm that Ddareungi stations were predominantly supplied to the Gangbuk area. This result suggests that the introduction of Ddareungi aimed to address the social exclusion issues related to the traditional existing transportation systems.
In 2021, the total number of Ddareungi stations reached 2,554, representing a nine-fold increase from 2016. As a result, only nine Dongs remained without a single Ddareungi station: Changsin 2-dong, Cheonggu-dong, Gireum 2-dong, Siheung 5-dong, Sangdo 3-dong and 4-dong, Sadang 4-dong, Cheongnim-dong, and Sinwon-dong. These Dongs are located within zones that have a high concentration of Ddareungi stations, such as the Central zone and the Southwestern zone. This indicates that people in these areas were expected to use the stations located in nearby surrounding Dongs. Therefore, the results indicate that the Ddareungi stations in 2021 not only increased quantitatively but also became relatively evenly distributed.
However, the third quartile map in Figure 1 shows that there were more Dongs corresponding to the third and fourth quartiles in Gangnam than in Gangbuk. Unlike in 2016, when Ddareungi stations were more concentrated in Gangbuk, the 2021 data suggests that the service level in Gangnam had surpassed that of Gangbuk, aligning with previous studies on Seoul's transportation gap. In addition, the distribution graph on the left shows that the Northeastern zone, the Central zone, the outskirts of the Northwest zone, and the outskirts of the southwest zone in Seoul still remain disadvantaged in terms of Ddareungi accessibility. This shows that Ddareungi stations were still unevenly distributed in 2021. Meanwhile, since this has not been empirically verified, further analysis using spatial econometric methods is necessary to assess the statistical significance of these spatial patterns.
2. Spatial Clustering of Ddareungi Station Locations
<Figure 3> presents Moran's I of the number of Ddareungi stations by year. Positive spatial correlations are found in both 2016 and 2021, indicating that the locations of Ddareungi stations are generally clustered rather than randomly distributed. This confirms the presence of spatial variation in the distribution of Ddareungi stations across Seoul. When Dongs with a high number of Ddareungi stations cluster together, and Dongs with few stations also cluster together, it creates a clear divide between areas with high and low accessibility to Ddareungi. This suggests that some areas had significantly better access to Ddareungi than others, reinforcing spatial disparities in public bicycle availability.

Moran’s I analysis
However, the Moran's I value in 2021 was approximately half of that in 2016, indicating that the degree of clustering decreased over time. In other words, while clustering was more pronounced in 2016 during the early stage of Ddareungi implementation, it became less severe in 2021, suggesting that the distribution of Ddareungi stations became more balanced over time.
<Figure 4> and <Figure 5> present LISA Cluster Maps, which visualize the results of the LISA analysis on the spatial distribution of Ddareungi stations in 2016 and 2021. In 2016, 50 H-H clusters, 19 L-L clusters, and 12 L-H clusters were identified, while no H-L clusters were found. This spatial distribution showed that most Ddareungi stations were highly concentrated in the Northwest and Central zones, while the Southeast zone is largely disadvantaged. A significant number of H-H clusters-where Dongs with many Ddareungi stations are surrounded by other Dongs with many Ddareungi stations-were found in the Northwest zone, which is famous for the Magok-Yeouido-Sangam business district, and the Central zone, which is the center of politics, administration, and economy as an old city center, and the number of the stations was also the highest in these zones.

2016 LISA cluster map

2021 LISA cluster map
Conversely, the L-L clusters-where Dongs with few or no Ddareungi stations are surrounded by other Dongs with similarly low access to Ddareungi-were found in areas with no Ddareungi stations at all. This confirms that in 2016, large portions of the southeast zone and adjacent areas remained entirely excluded from the Ddareungi network.
In 2021, there were 56 H-H clusters, 20 L-L clusters, 16 L-H clusters, and 4 H-L clusters. This represents an increase in all cluster types compared to 2016. Notably, the number of the H-H clusters was the highest, which can be attributed to the significant expansion of the Ddareungi network. Since only nine Dongs were without a Ddareungi station in 2021, it was more common for Dongs with many Ddareungi stations to be surrounded by other dongs with a high number of stations.
Although the absolute number increased, H-H cluster distribution in 2021 was more fragmented across different areas compared to 2016. The H-H clusters observed in the Southwest, Northwest, and Central zones in 2016 seemed to have been broken up into smaller, more dispersed clusters in 2021. This finding aligns with the Moran's I analysis, which showed a decline in clustering intensity over time. As a result, the spatial concentration of the locations of the Ddareungi stations in specific areas decreased, reducing previous access restrictions caused by uneven station distribution.
Despite this improvement, Ddareungi stations still tend to be spatially unequally located in 2021. A noticeable regional gap remained, particularly when comparing areas north and south of the Han River. H-H clusters were more distributed in Gangnam, with a large cluster forming particularly in the Southwest zone. These results are consistent with the previous studies that confirmed the transportation disparities between Gangnam and Gangbuk. Furthermore, these findings contradict the Seoul Metropolitan Government's plan to expand Ddareungi stations in Gangbuk in order to alleviate the transportation disparities and promote balanced urban development.
3. Determining Factors of Ddareungi Station Locations
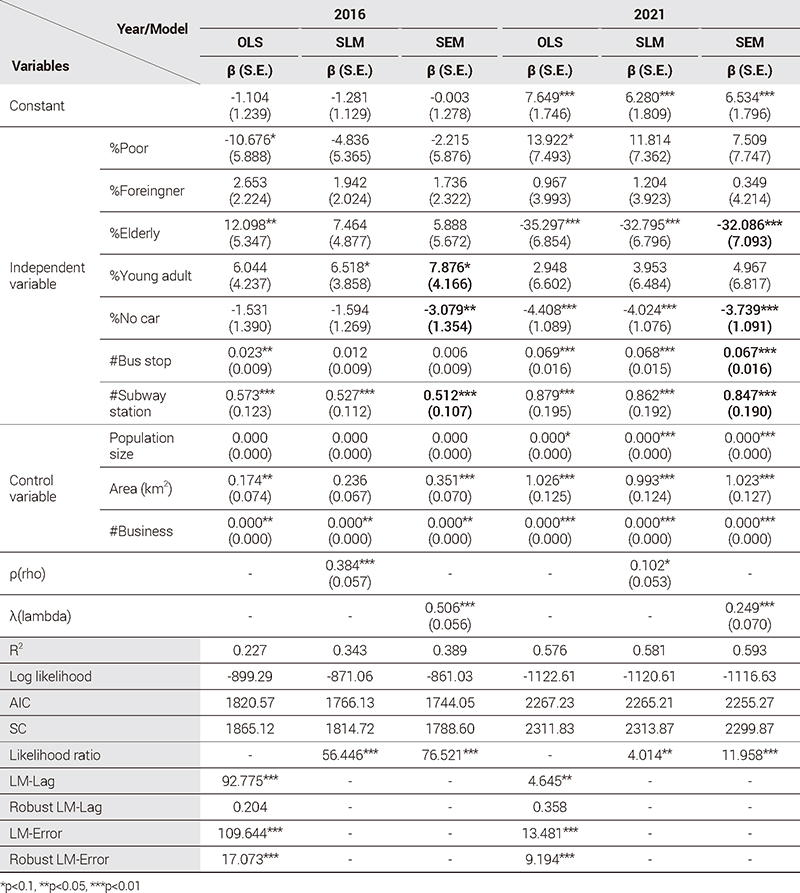
As shown in <Table 2>, the Lagrange Multiplier (LM) test identified the SEM as the most suitable model for estimating the number of Ddareungi stations in both 2016 and 2021. The SEM accounts for spatial dependence as an error term, which occurs when unobserved independent variables exhibit spatial dependence or when there is a mismatch between the spatial scope of data collection and the actual spatial range. This model suggests that even after controlling the explanatory variables, there still is a high spatial dependence among Dongs in terms of the number of Ddareungi stations, confirming that the Ddareungi stations are not evenly located by area, as also indicated by the previous Moran's I and LISA analyses.
Spatial regression estimates in 2016 & 2021
A comparison of the spatial regression analysis results across the two years reveals that the only variable that was significant in both 2016 and 2021 was the percentage of individuals without private cars. In both years, this variable was found to have a significantly negative effect on the number of Ddareungi stations by Dong. This indicates that areas with a higher percentage of individuals without private cars tended to have fewer Ddareungi stations.
On the other hand, the percentage of those living in poverty and the percentage of foreigners were statistically insignificant in the SEM model for both years. Interestingly, while the percentage of those in poverty was insignificant in SEM in both years, it was significant in the OLS. However, there was a notable shift in the regression coefficient for this variable between the two years in OLS; in 2016, the regression coefficient of the percentage of the poverty population was a negative value, while it was a positive value in 2021, suggesting that more Ddareungi stations were installed in areas with a higher percentage of poverty-stricken individuals. Moreover, the absolute value of the coefficient was larger in 2021 than in 2016, indicating a stronger relationship in 2021.
The major difference between 2016 and 2021 was found in the percentage of young people. In 2016, this variable had a significant negative (–) effect, meaning that Ddareungi stations were more frequently located in Dongs with fewer young people, effectively excluding them in 2016. However, by 2021, it was found to be insignificant, suggesting that young populations were not specifically considered in the selection of Ddareungi station locations.
Another key difference was observed in the percentage of elderly population. While this variable was insignificant in 2016, it had a significantly negative (–) effect in 2021, indicating that Ddareungi stations in 2021 were more likely to be located in areas with fewer elderly people. This finding suggests that in 2016, elderly populations were largely overlooked in station placement, while in 2021, station installations were concentrated in areas with relatively fewer elderly people.
The results of the spatial regression analysis showed that the most BEI variables did not have a significant effect on the number of the Ddareungi stations, highlighting a lack of consideration for socioeconomically disadvantaged groups in determining the location of the Ddareungi stations. The only variable that exhibited a significant effect in both 2016 and 2021 was the percentage of individuals without private cars. This variable had a significantly negative effect on the number of Ddareungi stations, meaning that Dongs where the percentage of individuals without private cars was higher had fewer Ddareungi stations. This suggests a misalignment between policy objectives and implementation.
In addition, differences in the impact of public transportation accessibility were also observed in both years. Since public bicycles are designed to connect the first and last miles between public transportation hubs and destinations, it is crucial for the Ddareungi stations to be located close to the public transportation hubs. However, in 2016, the number of bus stops was statistically insignificant, indicating that locations of the Ddareungi stations were not optimally placed to facilitate mobility for the first and last miles. In particular, these results are contrary to the contents of the '2016 Public Bicycle Station Selection Plan,' which emphasized the need to consider the distance from public transportation when selecting candidate sites for the Ddareungi stations. However, by 2021, it became significant, suggesting that this issue might have been addressed to some extent.
Moreover, the number of subway stations had a significantly positive (+) effect on the determination of the locations of the Ddareungi stations in both 2016 and 2021, with a stronger effect in 2021. Through this, it can be inferred that Dongs with a higher number of public transportation hubs were more likely to have more Ddareungi stations, thereby contributing to greater transportation equity.
Overall, these findings suggest that while Ddareungi station distribution improved over time, key disparities persisted, particularly for socioeconomically disadvantaged populations and individuals without private cars. Although progress was made in aligning station placement with public transportation hubs, further policy adjustments are necessary to enhance equitable access to Ddareungi stations across different demographic groups and geographic regions.
V. Conclusions
This study empirically examines the patterns and determining factors of the locations of Ddareungi stations in Seoul in 2016 and 2021. By analyzing the effectiveness of public bicycle policies and their temporal evolution, the study highlights the changes in policy direction and their impact on urban mobility.
The empirical results show that in both 2016 and 2021, Moran's I indicated a positive spatial correlation, suggesting a clustering pattern in Ddareungi station locations. The LISA analysis results revealed that administrative Dongs with a high number of Ddareungi stations are adjacent to those with many Ddareungi stations, forming H-H clusters. Notably, in 2021, H-H clusters were more concentrated in Gangnam than Gangbuk, confirming that the Ddareungi stations formed clusters in certain areas rather than being evenly distributed across areas. However, compared to 2016, the distribution in 2021 was more dispersed, with smaller and more diverse clusters, indicating a trend toward a more even spatial distribution. The results of the spatial regression analysis showed that most BEI variables were not statistically significant; the only exception was the percentage of individuals without private cars-which had a negative effect, confirming that there is a lack of consideration for socioeconomically disadvantaged groups in the decision to locate the Ddareungi stations. However, regarding the relationship with public transportation hubs, the number of bus stops, which was insignificant in 2016, became significant in 2021, and the number of subway stations, which was significant in both years, appeared to have a greater influence in 2021. This indicates integration of public bicycles with first- and last-mile mobility has improved over time.
By focusing on the spatial distribution of the Ddareungi stations, this study provides an empirical analysis of the system's evolution over time. In prior studies, the location of public bicycle stations has primarily been analyzed with a focus on short-term demand and usage promotion, with most analyses conducted over a single year or within a limited time period. However, since the policy and system may mature over time, it is necessary to collect the data of multiple years. Thus, the theoretical significance of this study is that the temporal scope of the analysis was set at 2016-the year when the Ddareungi policy was introduced, and 2021-the most recent year in which the Ddareungi station installation guidelines were presented.
Furthermore, this study has policy implications in that the results can be used to suggest ways to improve the transportation equity of locations in the operation and expansion of public bicycle policies such as Ddareungi. While the locations of the Ddareungi stations in 2021 were more evenly distributed compared to 2016, it still failed to completely resolve the transportation spatial disparities in Seoul, and consideration for socioeconomically disadvantaged groups was still lacking. This can be fundamentally attributed to the lack of consideration for equity in the current Ddareungi station installation guidelines. Therefore, the future expansion of public bicycle policies such as Ddareungi and the establishment of new stations should take equity into account. For instance, in the United States, car sharing services have alleviated social exclusion issues by relocating with government intervention (Kodransky and Lewenstein, 2014; Shellooe, 2013). Similarly, the Seoul Metropolitan Government has recognized the importance of public bicycle expansion in improving mobility as mentioned in the 'Seoul Metropolitan Government Regional Balanced Development Plan (2022-2026).' Thus, redistributing Ddareungi stations more strategically can be expected to enhance transportation equity.
More specifically, a macro-level approach should be adopted when determining the location criteria for Ddareungi stations across Seoul. The current guidelines focus only on the specific installation spots of individuals; however, such micro-level criteria fail to address equity throughout the entire Seoul region. The analytical results of this study show that Dongs with many Ddareungi stations are also located around Dongs with many Ddareungi stations, and that there is a lack of consideration for socioeconomically disadvantaged groups when determining the locations of the Ddareungi stations. To correct this disparity, the guidelines should be revised at a macro-level to prioritize station installations in areas where the proportions of individuals without private cars, recipients of Basic Livelihood Security, foreigners, and young people are high. In particular, individuals without private cars, who are considered to be the most disadvantaged group under the current system, should be the primary focus of future expansion efforts. The Ddareungi policy was originally introduced in order to break away from the car-centered urban transportation policy paradigm, yet this study found that in both 2016 and 2021, there were fewer Ddareungi stations in areas where the percentage of individuals without private cars was higher. This contradiction indicates a misalignment between policy objectives and implementation, emphasizing the need for a more equity-focused approach in future planning.
In addition, the analytic results of this study indicate that the locations of the Ddareungi stations have increasingly aligned with public transportation hubs, such as bus stops and subway stations in 2021 compared to 2016. Since Ddareungi serves as the first and last-mile mobility solution, this shift enhances accessibility for individuals with limited transportation options, such as individuals without private cars. To further strengthen the integration of public bicycles with public transport, future station placements should continue prioritizing locations near high-frequency transit hubs; just as the Ddareungi locations determined from 2016 to 2021 to strengthen connectivity with public transportation. The '2021 Seoul Bicycle Utilization Facility Installation and Management Guidelines' suggests that the Ddareungi stations be 'spaced apart by at least 10 m from a bus stop' in consideration of possible interference with existing facilities. However, additional considerations seem to be necessary for Ddareungi to faithfully serve as a first and last-mile mobility and improve mobility and transportation equity. In particular, it is essential not only to set a minimum distance between stations but also to establish a maximum distance from public transportation facilities, so that bicycle stations are located as close as possible to transit access points.
Despite these theoretical and policy implications, this study has some limitations. As a quantitative study relying only on data at the Dong level, it does not address how individuals in the BEI demographic categories perceive the accessibility of Ddareungi stations, nor does it explore how policymakers in Seoul consider equity in station placements. To address these issues, future studies may incorporate qualitative methods such as interviews. Additionally, due to the data availability constraints, this study was conducted at the Dong level. However, public bicycles such as Ddareungi are used for the first or last miles of travel and thus have a narrower service range. Therefore, follow-up studies should be conducted by acquiring finer data, such as census or grid level, to evaluate the equity of the locations of the Ddareungi stations more accurately.
Acknowledgments
This study was supported by the National Research Foundation of Korea funded by the Korean government (Ministry of Science and ICT) (No.2023R1A2C1004474).
Notes
References
-
Ahn, M.S. and Yi, C.H., 2022. “Analysis of Spatial Characteristics Affecting the Use of Public Bicycles: Case of ‘Tashu’ in Daejeon”, Journal of the Korean Regional Science Association, 38(4): 75-91.
안민수·이창효, 2022. “공공자전거 이용에 영향을 미치는 공간특성 분석-대전광역시 ‘타슈’를 대상으로”, 「지역연구」, 38(4):75-91. -
Anselin, L., 1995. “Local Indicators of Spatial Association-LISA”, Geographical Analysis, 27(2): 93-115.
[https://doi.org/10.1111/j.1538-4632.1995.tb00338.x]

-
Bhuyan, I.A., Chavis, C., Nickkar, A., and Barnes, P., 2019. “GIS-based Equity Gap Analysis: Case Study of Baltimore Bike Share Program”, Urban Science, 3(2): 42.
[https://doi.org/10.3390/urbansci3020042]
-
Burchardt, T., Le Grand, J., and Piachaud, D., 1999. “Social Exclusion in Britain 1991–1995”, Social Policy & Administration, 33(3): 227-244.
[https://doi.org/10.1111/1467-9515.00148]
-
Chen, Z., Guo, Y., Stuart, A.L., Zhang, Y., and Li, X., 2019. “Exploring the Equity Performance of Bike-sharing Systems with Disaggregated Data: A Story of Southern Tampa”, Transportation Research Part A: Policy and Practice, 130: 529-545.
[https://doi.org/10.1016/j.tra.2019.09.048]
-
Church, A., Frost, M., and Sullivan, K., 2000. “Transport and Social Exclusion in London”, Transport Policy, 7(3): 195-205.
[https://doi.org/10.1016/S0967-070X(00)00024-X]
-
Dear, M.J., 1974. “A Paradigm for Public Facility Location Theory”, Antipode, 6(1): 46-50.
[https://doi.org/10.1111/j.1467-8330.1974.tb00583.x]
-
Do, M.S. and Noh, Y.S., 2014. “Analysis of the Affecting Factors on the Bike-sharing Demand focused on Daejeon City”, Journal of Civil and Environmental Engineering Research, 34(5): 1517-1524.
[https://doi.org/10.12652/Ksce.2014.34.5.1517]
도명식·노윤승, 2014. “대전시 공유자전거 이용수요에 영향을 미치는 요인에 관한 연구”, 「대한토목학회논문집」, 34(5): 1517-1524. - Griffith, D.A., 1987. Spatial Autocorrelation: A Primer (Resource Publications in Geography), U.S.: Assn of American Geographers.
-
Jang, J.M., Gim, T.H., and Lee, M.Y., 2016. “A Study on the Seoul Public Bikes Use Characteristics -A Case of the Districts of Yeouido and Sangam-”, Seoul Studies, 17(4): 77-91.
장재민·김태형·이무영, 2016. “서울시 공공자전거 이용특성에관한 연구 –여의도 및 상암 지구를 사례로–”, 「서울도시연구」,17(4): 77-91. -
Kang, K.H. and Jung, J.W., 2019. “A Study on the Characteristics of Public Bicycles and Characteristics of Bicycle Stations in Seoul based on Social Network Analysis: Focused on 32 Bicycle Stations in Jung-gu”, Journal of Basic Design & Art, 20(6): 1-14.
[https://doi.org/10.47294/KSBDA.20.6.1]
강경희·정진우, 2019. “사회 네트워크 분석을 통한 서울시 공공자전거 따릉이 이용 특성 및 대여소의 특성에 대한 연구: 중구 32개 대여소를 중심으로”, 「기초조형학연구」, 20(6): 1-14. -
Kim, E.R. and Lee, M.H., 2004. “A Study on the Regional Urban Spatial Characteristics in Seoul”, Journal of Korea Planning Association, 39(5): 53-62.
김은래·이명훈, 2004. “서울시의 지역간 도시공간특성에 관한 연구”, 「국토계획」, 39(5): 53-62. -
Kim, J.M., Ki, D.H., and Lee, S.G., 2021. “Analysis of Travel Choice Change by the Spread of COVID-19: The Case of Seoul, Korea”, Journal of Korea Planning Association, 56(3): 113-129.
[https://doi.org/10.17208/jkpa.2021.06.56.3.113]
김진만·기동환·이수기, 2021. “COVID-19 확산에 따른 통행 수단 선택 변화 분석: 서울시 사례를 중심으로”, 「국토계획」, 56(3):113-129. -
Kim, J.Y. and Jun, H.J., 2020. “The Differences in the Level of Physical Activity and its Determinants between Gangnam and Gangbuk Areas in the City of Seoul”, Journal of the Korean Urban Management Association, 33(3): 1-31.
[https://doi.org/10.36700/KRUMA.2020.6.33.3.1]
김지영·전희정, 2020. “서울시 강남 3구와 강북 3구 간 신체활동수준 및 결정요인의 차이에 관한 연구”, 「도시행정학보」, 33(3):1-31. -
Kim, S.J., Kwak, M.J., Chu, S.H., and Kim, S.H., 2021. “Analysing Spatial Usage Characteristics of Shared E-scooter: Focused on Spatial Autocorrelation Modeling”, Journal of Korean Society of Intelligent Transport Systems, 20(1): 54-69.
[https://doi.org/10.12815/kits.2021.20.1.54]
김수재·곽민정·추상호·김상훈, 2021. “공유 전동킥보드의 공간적 이용특성 분석: 공간자기상관모형을 중심으로”, 「한국ITS학회 논문지」, 20(1): 54-69. -
Kim, Y.S., Park, S.O., and Park, K.W., 2020. “Analysis of the Seoul Public Bikes Usage for New Rental Locations”, The Korean Journal of Applied Statistics, 33(6): 739-751.
김예술·박시온·박건웅, 2020. “서울 공공자전거 신규 대여소를위한 수요량 예측 분석”, 「응용통계연구」, 33(6): 739-751. - Kodransky, M. and Lewenstein, G., 2014. Connecting Low-income People to Opportunity with Shared Mobility, New York: ITDP.
-
Korea Consumer Agency, 2018. Safety Survey on Personal Mobility, Chungbuk.
한국소비자원, 2018. 「개인형 이동수단 안전실태조사」, 충북. -
Korea Planning Association, 2009. National & Regional Planning (3rd edition), Seoul: Boseounggak.
대한국토·도시계획학회, 2009. 「국토·지역계획론(3정판)」, 서울: 보성각. -
Korea Planning Association, 2016. Introduction to Urban Planning (6th edition), Seoul: Boseounggak.
대한국토·도시계획학회, 2016. 「도시계획론(6정판)」, 서울: 보성각. -
Lee, H.J., Ha, J.H., and Lee, S.G., 2017. “An Analysis on the Equity of Public Transit Service using Smart Card Data in Seoul, Korea – Focused on the Mobility of the Disadvantaged Population Groups –”, Journal of the Korean Regional Science Association, 33(3): 101-113.
이호준·하재현·이수기, 2017. “스마트카드 자료를 활용한 서울시 대중교통 서비스 형평성 분석 – 취약계층 유형별 이동성을 중심으로 –”, 「지역연구」, 33(3): 101-113. -
Lee, H.Y. and Shim, J.H., 2011. Geographic Information Systems, Gyeonggi: Bobmunsa.
이희연·심재현, 2011. 「지리정보학」, 경기: 법문사. -
Lee, J.Y. and Leem, Y.T., 2010. “The Establishment of B-TOD Concept and Setting up Transit Access Distance by Cycling”, Journal of Korea Planning Association, 45(6): 149-160.
이재영·임윤택, 2010. “자전거이용행태 기반 TOD (B-TOD) 의개념 및 계획권 설정연구”, 「국토계획」, 45(6): 149-160. -
Lee, K.H. and Seo, S.J., 2009. “A Study on the Regional Disparity between the Major 3 Gangnam Districts and the Major 3 Gangbuk Districts in Seoul”, Korean Public Management Review, 23(4): 357-381.
[https://doi.org/10.24210/kapm.2009.23.4.015]
이규환·서승제, 2009. “서울시 자치구간 지역격차에 관한 연구:강남 3구와 강북 3구의 비교”, 「한국공공관리학보」, 23(4): 357-381. -
Lee, K.Y., Jeong, J.H., and Jun, H.J., 2018. “The Effect of Regional Disparity and Housing Characteristics of Seoul’s Gangnam and Gangbuk Districts on the Social-Class Recognition: Focusing on Low-Income Class Recognition”, Journal of the Korean Urban Management Association, 31(1): 77-100.
[https://doi.org/10.36700/KRUMA.2018.03.31.1.77]
이경영·정주희·전희정, 2018. “서울시 강남·강북권 간 지역격차및 주거특성이 주민의 사회적 지위 인식에 미치는 영향: 하위계층을 중심으로”, 「도시행정학보」, 31(1): 77-100. -
Lee, S.E. and Choi, Y.S., 2010. “Income and Asset Differentials in Gangnam and Non-Gangnam Households in Seoul: An Application of Oaxaca Decomposition Method”, Korean Journal of Social Welfare, 62(3): 31-58.
[https://doi.org/10.20970/kasw.2010.62.3.002]
이상은·최유석, 2010. “서울시 강남과 비강남 지역간 소득 및 재산 격차와 요인분해”, 「한국사회복지학」, 62(3): 31-58. -
Lee, S.Y., Shin, E.G., and Kim, S.Y., 2014. “Impacts of the Regional Environment Characteristics on the Public Bicycle Use-Analysis of the Spatial Information Using the Public Bicycles OD Flow-data in Changwon-si-”, Journal of the Architectural Institute of Korea Planning & Design, 30(12): 215-223.
[https://doi.org/10.5659/JAIK_PD.2014.30.12.215]
이슬이·신은경·김세용, 2014. “공영자전거 이용에 영향을 미치는 지역적 환경특성 연구: 창원시 공영자전거 OD 데이터를 활용한 공간정보 분석”, 「대한건축학회 논문집-계획계」, 30(12): 215-223. -
Lee, W.D., Na, Y.G., Park, S.H., Lee, B.J., and Jo, C.H., 2012. “Transportation Equity Analysis Based on the Metropolitan Household Survey”, Journal of the Korean Urban Geographical Society, 15(1): 75-86.
이원도·나유경·박시현·이백진·조창현, 2012. “수도권 가구통행조사를 바탕으로 한 교통 형평성 분석”, 「한국도시지리학회지」,15(1): 75-86. -
Levinson, D., 2010. “Equity Effects of Road Pricing: A Review”, Transport Reviews, 30(1): 33-57.
[https://doi.org/10.1080/01441640903189304]
- Litman, T., 2003. Social Inclusion as a Transport Planning Issue in Canada, Victoria Transport Policy Institute.
-
Moudon, A.V., Lee, C., Cheadle, A.D., Collier, C.W., Johnson, D., Schmid, T.L., and Weather, R.D., 2005. “Cycling and the Built Environment, a US Perspective”, Transportation Research Part D: Transport and Environment, 10(3): 245-261.
[https://doi.org/10.1016/j.trd.2005.04.001]
- Prelog, R., 2015. Equity of Access to Bicycle Infrastructure: GIS Methods for Investigating the Equity of Access to Bike Infrastructure, Washington, DC: League of American Bicyclists.
-
Sa, K.E. and Lee, S.G., 2018. “Analysis of Physical Characteristics Affecting the Usage of Public Bike in Seoul, Korea: Focused on the Different Influences of Factors by Distance to Bike Station”, Journal of Korea Planning Association, 53(6): 39-59.
[https://doi.org/10.17208/jkpa.2018.11.53.6.39]
사경은·이수기, 2018. “서울시 공공자전거 이용에 영향을 미치는물리적 환경 요인 분석: 대여소별 거리에 따른 요인의 영향력 차이를 중심으로”, 「국토계획」, 53(6): 39-59. - Shaheen, S., Bell, C., Cohen, A., and Yelchuru, B., 2017. Travel Behavior: Shared Mobility and Transportation Equity, U.S. Department of Transportation (No. PL-18-007).
- Shellooe, S.D., 2013. “Wheels When Who Wants Them: Assessing Social Equity and Access Implications of Carsharing in NYC”, Master’s thesis, Columbia University.
-
Teitz, M.B., 1968. “Toward a Theory of Urban Public Facility Location”, Papers of the Regional Science Association, 21(1): 35-51.
[https://doi.org/10.1111/j.1435-5597.1968.tb01439.x]
-
Tiebout, C.M., 1956. “A Pure Theory of Local Expenditures”, Journal of Political Economy, 64(5): 416-424.
[https://doi.org/10.1086/257839]
-
Youn, H.H. and Lim, B.I., 2012. “Analysis of Income Gap and Income Inequality among Regional Segments of Seoul between 2001 and 2009”, Seoul Studies, 13(2): 1-15.
윤형호·임병인, 2012. “서울시의 권역 간 소득격차와 소득불평등추이 분석(2001~ 2009년)”, 「서울도시연구」, 13(2): 1-15. -
Yun, J.M. and Lee, S.H., 2010. “A Study on the Location Analysis of Public Service Facilities Considering Spatial Efficiency and Equity”, Journal of the Korean Association of Geographic Information Studies, 13(2): 1-10.
윤정미·이신훈, 2010. “효율성과 형평성을 고려한 공공시설 입지분석에 관한 연구 –금산군 문화시설을 대상으로–”, 「한국지리정보학회지」, 13(2): 1-10. -
Zuo, T., Wei, H., Chen, N., and Zhang, C., 2020. “First-and-last Mile Solution via Bicycling to Improving Transit Accessibility and Advancing Transportation Equity”, Cities, 99: 102614.
[https://doi.org/10.1016/j.cities.2020.102614]