Final publication date 13 Sep 2023
Facility Resources Allocation Model Response to Spread of Infectious Diseases : Focusing on COVID-19 Isolation Facilities
Abstract
In the COVID-19 pandemic's wake, the necessity for efficient isolation facilities escalated worldwide. Even after the emergency situation has been addressed, ongoing preventive measures for effective risk response continue to be essential. This study proposes a dynamic model for effectively allocating and operating isolation facilities, with a specific focus on South Korea's Residential Treatment Centers (RTCs). It sets out criteria for the suitable selection of RTCs, focusing on facility ownership, isolation suitability, and operational efficiency while considering the entire process of securing, converting, and operating facilities as RTCs. Furthermore, the Facility Location and Scheduling Model adopts a strategic approach to managing inevitable trade-offs in resource allocation and offers a quantifiable method to determine the location and operating schedule of RTCs. Drawing from a case study in Incheon Metropolitan City, the study highlights that while public facilities offer advantages in accessibility and conversion, private facilities are vital for effective response. Therefore, it emphasizes the importance of governments and local authorities in identifying and collaborating with potential private facilities for emergency conversion into isolation centers. These insights can contribute to a resilient society by suggesting strategies for operating isolation facilities in future infectious disease outbreaks.
Keywords:
Infectious Disease, COVID-19, Facility Resources, Isolation Facilities, Resource Allocation Model키워드:
감염병, 코로나바이러스감염증-19, 시설자원, 격리시설, 자원배분모델Ⅰ. Introduction
The World Health Organization (WHO) announced in May 2023 that the status of COVID-19 had transitioned from a public health emergency of international concern, initially declared in January 2020, to a continuing health threat (WHO, 2023). Nevertheless, the WHO highlighted that the global population has yet to completely escape the public health risks caused by COVID-19 and advised ongoing preventive measures for effective risk response even after the emergency situation was lifted (WHO, 2023).
At the onset of the outbreak, when the virus was not well understood, the rapid increase in patients led to issues like a shortage of beds and disparities in medical resources, and it was pointed out that isolation measures were needed for mild patients who account for 80% of all patients (Ministry of Health and Welfare, 2020a).
Facility-based isolation is widely used in South Korea, China, and Singapore (Chen et al., 2021). In South Korea, many isolation facilities called “residential treatment centers (RTCs)” were introduced to manage patients from the early stage of COVID-19.
The RTC is an independent medical facility that was operated separately from conventional hospitals. Its purpose is to isolate and monitor individuals with mild symptoms, thereby conserving advanced medical resources and mitigating the risk of disease transmission. It has been evaluated as a successful initiative in distributing medical resources during a crisis (Park et al., 2020). In Korea, RTCs are classified into two types: central and local. The national government operates the central type and serves patients on a regional level by collaborating with two or three neighboring local governments. In contrast, the local type is managed by individual local governments and accommodates patients from their respective jurisdictions. Candidate facilities for RTCs include both public and private establishments, such as educational and training facilities, university dormitories, and hotels. These facilities are designated as RTCs based on consultations and private facilities were paid a certain fee for using them as RTCs.
Despite such achievements and necessity, significant challenges were encountered in securing facilities for RTCs due to issues like resident protests, inequitable distribution of facilities, patient transfer, and conflicts during negotiations for utilizing private facilities. For instance, resident protests have been a contributing factor in delaying the opening of RTCs, regardless of whether the facilities were publicly or privately owned. In order to secure the requisite number of beds to accommodate a rapidly increasing patient population, both public and private facilities were concurrently considered. Subsequently, those facilities that received owner approval were officially designated as RTCs. The number of beds in RTCs was increased to accommodate the growing number of patients, recorded as 10,808 on December 22, 2020, 17,764 on December 21, 2021, and 20,244 on March 5, 2022 (Ministry of Health and Welfare, 2022).
Through the experiences of dealing with COVID-19, it was recognized that the impacts of infectious diseases are not limited to the health and medical sectors but can pervade society. Therefore, it was underscored that the importance of securing facilities for preventing the spread of infectious diseases as social capital is crucial for preparing for potential future uncertainties (Ha, 2020).
Since the 1970s, over 30 major novel infectious diseases have been discovered, and new infectious diseases continue to emerge (Chun, 2015). Due to continuing globalization and urbanization, the spread of such novel infectious diseases could potentially occur at any time (Jo, 2020).
In this regard, it is necessary to identify local resources that can be promptly allocated for emergency healthcare, such as isolation and treatment when an infectious disease outbreak occurs, and to seek a utilization system including resource allocation and scheduling based on local infection trends and characteristics.
This study suggests a model for the location and scheduling of isolation facilities, which are an essential element of disaster management resources, in response to infectious diseases with characteristics of community spread. To achieve this, we first investigated the distribution of facility resources utilized as isolation facilities and made the list of candidate list for isolation facilities. Secondly, we develop the facility location and scheduling model using optimization techniques.
Ⅱ. Literature Review
In the wake of the COVID-19 outbreak, research on the location and capacity design of emergency facilities has garnered significant attention. Researchers have striven to formulate effective and resilient facility locations, such as testing and vaccination facilities, hospital operations, and casualty transportation (Liu et al., 2023; Rautenstrauss et al., 2023; Risanger et al., 2021; Shaker Ardakani et al., 2023; Taiwo, 2021; Thul and Powell, 2023; Yin et al., 2023).
We concentrate on the problem of locating and scheduling isolation facilities, considering effective operating costs and patient dispatching distances. There are numerous prior studies concerning temporary facility location and casualty allocation planning in the context of health emergencies like disease outbreaks and natural disasters (Devi et al., 2022; Liu et al., 2019; Sun et al., 2021; Verma and Gaukler, 2015). For instance, Verma and Gaukler (2015) proposed disaster response facilities for emergency supply storage during an earthquake to minimize transportation costs under the constraint of a limited number of facilities. Kongsomsaksakul et al. (2005) proposed a location-allocation model for flood evacuation shelters considering the decision of authorities and evacuees.
While these studies assumed fixed demands for facilities, situations like pandemics often require the selection of locations considering factors such as cost and time (Boonmee et al., 2017). Consequently, a dynamic facility location problem has been proposed for temporary facility planning. Given the dynamic nature of COVID-19 and the changing demands for facilities, addressing the dynamic change of demands becomes a critical issue. Hosseini-Motlagh et al. (2023) suggested COVID-19 control strategies by locating screening facilities, health facilities, and isolation facilities in order to minimize transmission rates, taking into account factors such as positive rates, underlying conditions, and death rates. Aydin and Cetinkale (2023) considered the scenario of a large-scale earthquake occurring during an ongoing pandemic and proposed a model for determining the necessary number and location of temporary healthcare facilities based on a revised compartmental model for COVID-19 transmission.
Based on the previous literature, this study made three primary contributions. Firstly, this study developed a model for the location and operating schedule of isolation facilities, taking into account dynamic patient needs. Although some studies have proposed facility location models that consider dynamic changes in demands, these models assume that the assigned facilities operate throughout the entire period. In contrast, in countries like Korea, patients with mild symptoms were isolated outside hospitals, utilizing both private and public facilities, with varying operating periods based on infection numbers (Yang et al., 2020). Thus, the effective operation of isolation facilities necessitates flexibility in response to infection trends.
Secondly, our model considered both facility conditions (capacity, ownership, and staff) and accessibility. Especially, considering accessibility is a significant challenge due to the lack of location information for patients at a fine-grained spatial scale. Many countries collect patient information at the city level, and infection predictions have been conducted at the city or county level. Our model considered the mean accessibility, taking into account the spatial distribution of RTCs and population, and makes it possible to strike a balance between facility cost and patient accessibility.
Thirdly, we identified the critical RTCs necessary for effective isolation, considering different infection scenarios and operation strategies. Allam and Jones (2020) emphasized urban restructuring focusing on emergency preparedness to control pandemics and showed that many cities constructed new medical facilities to increase the capacity for handling emergency cases. Identifying important and critical RTCs for infectious disease management makes it possible to respond rapidly based on prior consultations and prevent the decrease in the functioning of cities.
Ⅲ. Methodology
1. Target Area and Period
In this study, we investigated resources that can be utilized as RTCs and applied the suggested model in Incheon Metropolitan City. As of the end of October 2021, there were approximately 19,400 cumulative confirmed cases, making it the third-highest in the country, following Seoul and Gyeonggi Province (Statistical Geographic Information System, n.d.).
We selected Incheon for two primary reasons. Firstly, Incheon operated RTCs, which included both public and private facilities. Regarding COVID-19 response facilities, two private hotels located in Jung-gu, which is close to Incheon International Airport on Yeongjong Island, were converted and operated as temporary residential facilities (as of October 2020). Additionally, two training centers located in Jung-gu (established in September and December 2020) and one training center located in Seo-gu (established in December 2020) were transformed and operated as RTCs (Central Disaster and Safety Countermeasures Headquarters and Central Disease Control Headquarters, 2021). Secondly, Incheon includes both urban and rural areas, and the uneven distribution of facilities can cause inconvenience for patients due to long distances.
This study analyzed a 100-day period starting from July 30, 2020, as the target period for analysis. Even though we selected Incheon for the case study, we developed a facility location and scheduling model that can be universally applied to various cities.
2. Analysis on Facility Candidates
We gathered information on RTCs that were established and operated nationwide from March to December 2020. Our study focused on 55 facilities with accessible operational data. The data collection process involved the comprehensive utilization of government and local authority press releases, media reports, and online portal searches (Ministry of Health and Welfare, 2020b; Shin, 2020). The collected information included previous usage of the facilities prior to their conversion into RTCs, ownership (government-owned, shared, privately owned), operating entities responsible for their establishment (central government, local authorities), and facility size. Additionally, we explored the ease of facility procurement through interviews with relevant stakeholders.
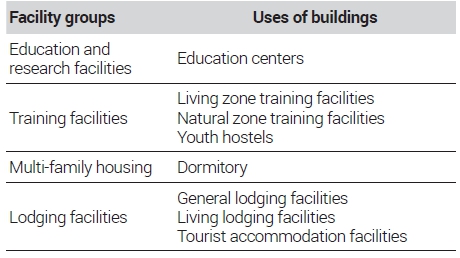
Based on these findings, in the selection of spatial resources in Incheon Metropolitan City, we identified potential facilities through the architectural administration system based on <Table 1> of the Enforcement Decree of the Building Act. When considering dormitories, university dormitories were included based on the previous operating cases. Among the extracted facilities, we excluded unsuitable facilities based on relevant laws. Specifically, we excluded facilities in the absolute protection zone defined by the Educational Environment Protection Act.
3. Infection Scenarios
Using the effective reproduction number, we set the two scenarios for the stages of infectious disease spread. The process involved estimating the effective reproduction number based on the actual number of infected patients, setting the stages of disease spread, and creating patient occurrence scenarios based on the effective reproduction number. We set the two effective reproduction numbers depending on the severity of the spread.
To estimate the effective reproduction number, we utilized the COVID-19 incidence. The calculation of the effective reproduction number was performed using the ‘EpiEstim’ package in R, assuming a generation interval that follows a gamma distribution with a mean of 4.8 days and a standard deviation of 2.3 days, as suggested by the WHO-PAHO (Pan American Health Organization, 2020).
Based on the estimated effective reproduction number and COVID-19 incidence in Incheon, we projected the infection scenario using the ‘Projections’ package in R. <Figure 1> presents the estimated number of patients to be isolated in two scenarios. According to the experiences of previous patients (Ministry of Health and Welfare, 2020a), we assumed that 80% of infected cases should be isolated.
Scenario 1 represents a scenario with the same effective reproduction level observed during the highest spread in Incheon Metropolitan City (August 6th to August 24th, 2020). In this scenario, the estimated maximum number of daily new cases was 26, the maximum cumulative number of individuals under isolation during the spread period was 242, and the cumulative number of confirmed cases was 660.
Scenario 2 represents a scenario that applies a disease spread similar to the cluster outbreaks in the Daegu-Gyeongbuk region in March 2020 to Incheon Metropolitan City. In this scenario, the estimated maximum number of daily new cases was 240, the maximum cumulative number of individuals under isolation during the spread period was 2,292, and the cumulative number of confirmed cases was around 6,274.
The real number of infections can be used for the suggested model. However, we used the estimated number of infections to discuss the differences in RTCs scheduling and allocation results under the same assumption exempting the effective reproduction number.
4. Facility Operating Strategies
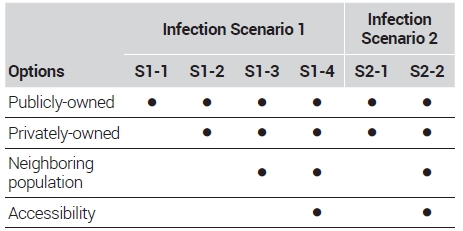
Regarding the facility operation strategies, we established two options considering the range of facilities for securing necessary capacity: one utilizing only publicly-owned resources and the other incorporating privately-owned resources. In addition, we incorporated the aspect of facility location conditions from the perspectives of the neighboring population and accessibility. The neighboring population was defined as the sum of the population within a 1 km radius of the candidate facility. We calculated the population by 250 m by 250 m grid in 2021. The accessibility of each facility was defined by the mean network distance from all population grids. High accessibility considering all populations can be considered as good location that can reduce the travel time of patients. However, it should be noted that it does not exactly indicates the accessibility of patient considering the real number of infections. <Table 2> summarizes the six different strategies, and we compared the performance of each strategy.
5. Facility Location and Scheduling Model
This study presents the model to determine the number and location, and operating period of RTCs to secure the necessary facilities considering operating costs, patient travel distances, and neighboring population. We assumed that the number of confirmed cases is estimated at the city level. Then, all confirmed cases with mild symptoms are assigned to RTCs.
The objective function, represented by Formulation (1), aims to minimize the sum of facility operating cost, patient travel distance, and neighboring population. The facility operating cost includes the difficulty of conversion, necessary staff, and initial conversion cost.
| (1) |
Subject to
| (2) |
| (3) |
| (4) |
| (5) |
Sets
I : Set of candidate facilities i={1, 2, ..., I}
T : Set of time period t={0, 1, 2, ..., T}
Parameters
Ri: Conversion difficulty of facility i
Si: Necessary staff of facility i
ci: Capacity of facility i
Pi: The number of population within a 1 km radius of facility i
Di: Population-weighted mean network distance of facility i
wP, wD: Weights of neighboring population and accessibility
nt: The number of patients to be isolated at t period
F: Conversion cost
Decision variables
xit: Equal 1 if RTF is operated in location i and period t; otherwise, 0
yit: Equal 1 if RTF is established in location i and period t; otherwise, 0
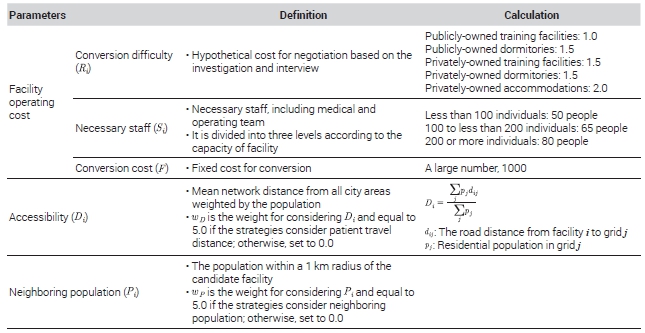
<Table 3> provides an overview of the parameters used in the model. The conversion difficulty (Ri) was decided by the ownership of the facility, based on the investigation of previous RTSs and the interview. Public training facilities were assigned a low value as they are managed by the public sector and are not fully occupied by users. Conversely, private hotels were assigned a high conversion difficulty value due to negotiation, guest, and cost-related challenges. The required number of staff members (Si) was estimated based on findings from Yang's (2020) investigation1). Conversion cost (F) was set as large to prevent excessive selection and a too-short operating period. Regarding locational features, The population-weighted mean network distance to the facility from the entire city was used for quantifying accessibility. Finally, the population within km of the candidate facility was considered as the neighboring population (Pi). This model considers each facility independently and does not account for the cooperation between facilities to prevent inter-facility infection.
Formulation (2)-(5) are necessary constraints. Formulation (2) ensures that the capacity of the operating facility is greater than or equal to the number of patients to be isolated during period t, including both newly confirmed cases and cases already under isolation before period t. The isolation period for patients is assumed to be 14 days. Formulation (3) determines the establishment of a facility during period t. Formulation (4) prohibits the re-designation of a previously released facility for use as an RTF. Lastly, Formulation (5) stipulates that the operating period of a designated facility should be at least 15 days (14 days for isolation and one day for preparation).
Ⅳ. Results
1. Distribution and Characteristics of Facility Resources
By extracting building usage data from the architectural administration system and examining each facility's status, we investigated and classified candidate facilities suitable for use as RTCs in Incheon Metropolitan City. As a result, a total of 30 resources with 6,700 rooms were identified.
Identifying the parameters of each facility is essential to apply the facility location and scheduling model. Thus, we summarized the features of the 30 surveyed facilities based on their building usage, ownership, and isolation capacity in <Table 4>. The facility resources were classified into three categories based on the number of rooms: small-scale for fewer than 100 rooms, medium-scale for 100 rooms or more but fewer than 200 rooms, and large-scale for 200 rooms or more. <Figure 2> presents the distribution of candidate facilities. The candidate facilities tend to cluster in specific areas rather than being evenly distributed throughout the area. In terms of specific areas, there is a concentration of facilities in Jung-gu, Yeonsu-gu, Seo-gu, and Ganghwa-gun, while Dong-gu and Ongjin-gun appear to lack candidate facilities.
There are only two medium to large-sized publicly-owned facilities that have low conversion difficulty and high operating efficiency. In contrast, privately-owned facilities are evenly distributed in terms of size. However, facilities belonging to training centers or institutes, which have been commonly utilized as RTCs, are all small-scale, resulting in low operational efficiency.
2. Facility Location and Scheduling Results
In Scenario 1, the maximum number of daily isolated patients is 242, which, in terms of total capacity, can be accommodated within the publicly-owned facilities. However, except for two large-scale facilities (over 1,000 rooms), the publicly-owned facilities in Incheon are mostly small-scale, with fewer than 100 rooms. <Figure 3> presents the capacity of the assigned facility and the number of isolated patients. If only publicly-owned resources are considered, it would require converting four facilities, including the large-scale facility. This would lead to inefficiencies during the initial stage of infection due to the high vacancy rate. Therefore, securing privately-owned facilities through a mixed conversion approach from the early stages of infection spread is necessary.

Operating facility capacity and the number of isolated patients for S1-1 and S1-2Note: In the bar graph, each color represents a different facility, and the height of the bar indicates the capacity of that facility. Blue bars represent public facilities, while red bars represent private facilities. The solid line depicts the number of isolated patients.
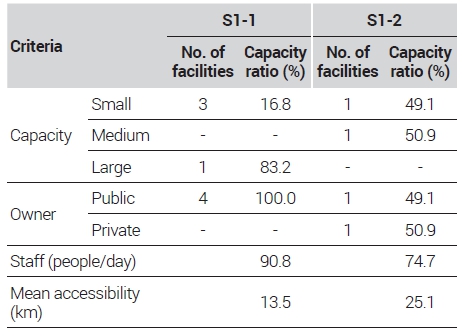
<Table 5> presents the comparison between S1-1 and S1-2. The capacity ratio is the value calculated by considering the number of operating days, which represents the share of a specific category of facility within the total capacity. Mean staff is the value obtained by dividing the sum of the product of the operating days and the necessary number of staff for each facility by the total number of days in the target period. In this case (A1), by securing one medium-scale privately-owned resource, the number of resources to be converted (from 4 to 2) and the necessary staff (from 147 staff per day to 120 staff per day) can be reduced. Thus, during the initial stages of infection spread, it would be beneficial to isolate patients in publicly-owned resources, which are more easily convertible, while preparing to convert a medium-scale privately-owned facility for the rapid increase in patient numbers.
To consider the suitable location of facilities, we considered location features: neighboring population and accessibility of patients. S1-3 added only the neighboring population to the objective function. <Figures 4 and 5> present a summary of the results and the spatial distribution of selected facilities, respectively. The result shows that operating the privately-owned training center in Seo-gu and the publicly-owned training centers in Jung-gu (Yeongjong Island) would be sufficient for the response. However, it should be noted that the facility in Yeongjong Island has low accessibility from the population and to the hospital. As a result, the travel distance for isolated patients would significantly increase. S1-4, which considered both the neighboring population and accessibility from the population, showed that securing three resources in Seo-gu and Bupyeong-gu would be necessary for response. Although S1-4 requires a slightly increased number of resources, the mean travel distance for isolated patients would decrease by nearly half in <Table 6>. Considering the current entry and discharge procedures that patients have to return to their homes by themselves, selecting resources based on location factors could lead to an increase in the convenience of patients.

Operating facility capacity and the number of isolated patients for S1-3 and S1-4Note: In the bar graph, each color represents a different facility, and the height of the bar indicates the capacity of that facility. Blue bars represent public facilities, while red bars represent private facilities. The solid line depicts the number of isolated patients.

Spatial distribution of selected facility in S1-3 and S1-4 (Circle size of selected facility: capacity of each operating facility, grid color: the number of population)
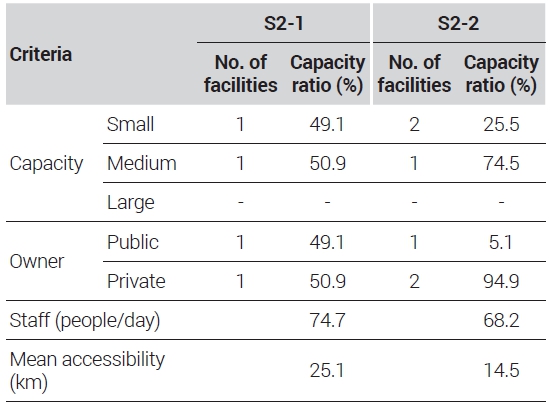
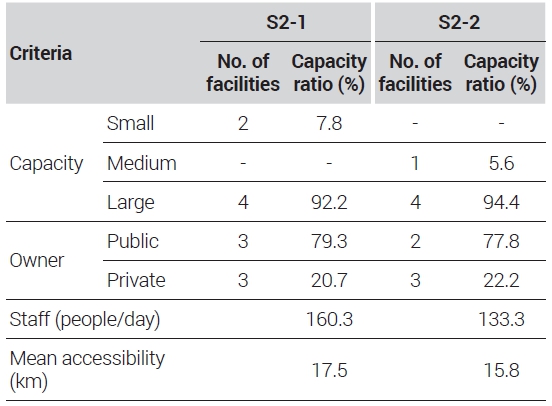
In Scenario 2, the maximum number of daily isolated patients is 2,292, which, in terms of total capacity, can be accommodated within the publicly-owned resources within the city. However, similar to Scenario 1, it would require the conversion of multiple small-scale resources, leading to a significant decrease in efficiency. Therefore, it is necessary to secure both publicly- and privately-owned facilities from the early stages. For Scenario 2, two strategies were compared: the capacity-only strategy and the capacity and location feature strategy. <Table 7> summarizes the model result, and <Figure 6> presents the operation schedule of facilities. The capacity-only strategy would involve utilizing six resources, including one publicly-owned resource in Jung-gu (Yeongjong Island) and one privately-owned resource in Ganghwa Island in <Figure 7>, to accommodate isolated patients. The estimated allocation of staffs for daily operations would be approximately 160 individuals in <Table 7>.

Operating facility capacity and the number of isolated patients for S2-1 and S2-2Note: In the bar graph, each color represents a different facility, and the height of the bar indicates the capacity of that facility. Blue bars represent public facilities, while red bars represent private facilities. The solid line depicts the number of isolated patients.

Spatial distribution of selected facility in S2-1 and S2-2 (Circle size of selected facility: capacity of each operating facility, grid color: the number of population)
However, a more suitable resource allocation can be achieved when considering both the population density in the surrounding areas of spatial resources and the travel distance of isolated patients. As shown in <Figure 7>, utilizing a total of five resources centered around Seo-gu and Yeonsu-gu would be sufficient to respond to the situation.
Ⅴ. Discussion and Conclusion
In the wake of COVID-19, the importance of effective isolation facilities for mild symptomatic patients has been underscored. While countries like South Korea have implemented strategies such as RTCs, significant challenges remain in securing suitable facilities and effectively operating them. In this study, we propose a model for allocating and operating isolation facilities in response to community spread infectious diseases. This study had four main findings.
First, we suggested a facility location and scheduling model in consideration of dynamic patient needs and facility operating periods. Unlike traditional models that operate under static assumptions, our model recognizes that disease spread is a dynamic process with evolving demands. Hence, it provides scheduling of facility operations based on the projected number of confirmed cases, ensuring an efficient and responsive allocation of resources. Also, the suggested model can be introduced in geographic contexts.
Second, we provided criteria for the selection of suitable facilities to be utilized as RTCs from a wide range of facilities available in the local community. Considering that RTCs function as isolation facilities, our criteria primarily focused on the suitability of the building usage for individual isolation purposes. Furthermore, we took into account the entire process of securing, converting, and operating facilities as RTCs, which led us to establish selection criteria based on the ownership status of the facilities to ensure ease of acquisition and conversion, as well as the facility size to optimize operational efficiency. These criteria can serve as valuable guidelines for implementing a similar approach in different regions.
Third, our model provides a strategic approach to the trade-offs that occur in resource allocation, considering both facility cost and accessibility. These trade-offs can manifest as conflicts between the ease of conversion of a facility and its location, or between operating costs and patient convenience. By quantifying these variables and incorporating them into an objective function, our model offers an analytical way to navigate these trade-offs and arrive at optimal solutions. Especially, our model can consider the accessibility of patients by introducing a mean accessibility that accounts for both population and facility distributions, even in the absence of fine-grained location information.
Fourth, this study identified critical facilities considering different scenarios and strategies. Our result highlighted that while public facilities have advantages in terms of accessibility and conversion, private facilities can be critical in ensuring effective response, especially in the early stages of infection spread, to avoid resource inefficiencies. Urban planning emerged as a response to public health problems, including epidemics. Urban restructuring focusing on emergency preparedness to control pandemics is important to prevent the decrease in the functioning of cities. Identifying important and critical RTCs can contribute to urban planning for securing public health. However, the actual process of securing private resources for Residential Treatment Centers (RTCs) often entails legal and administrative complexities, emphasizing the need for advanced planning and coordination. If local governments can proactively identify private facilities suitable for conversion into RTCs and designate them as “disaster management resources” based on the Framework Act On The Management Of Disasters And Safety, their response measures are likely to be more effective in emergency situations.
However, this study has several limitations. The modeling parameters were simplified due to insufficient information and computational efficiency. For example, the operating cost based on the operation history can improve the reality of the model. Additionally, the study only considers patients with mild symptoms, whereas, in reality, the emergency supply chain considering the connection between RTCs and hospitals, is required to respond to different symptom severity. Lastly, considering inter-municipal cooperation is necessary to apply our model to small cities that manage patients at the provincial level due to a lack of facilities and staff at the city level.
Acknowledgments
This work is based on the research project “Establishment of the System for Using Local Spatial Resources in Response to Infectious Diseases” conducted by AURI in 2021, and supported by in part by JSPS KAKENHI Grant Numbers JP23K13460 and the Hirose Foundation.
References
-
Allam, Z. and Jones, D.S., 2020. “Pandemic Stricken Cities on Lockdown. Where Are Our Planning and Design Professionals [Now, Then and Into the Future]?,” Land Use Policy, 97: 104805.
[https://doi.org/10.1016/j.landusepol.2020.104805]

-
Aydin, N. and Cetinkale, Z., 2023. “Simultaneous Response to Multiple Disasters: Integrated Planning for Pandemics and Large-scale Earthquakes,” International Journal of Disaster Risk Reduction, 86: 103538.
[https://doi.org/10.1016/j.ijdrr.2023.103538]

-
Boonmee, C., Arimura, M., and Asada, T., 2017. “Facility Location Optimization Model for Emergency Humanitarian Logistics,” International Journal of Disaster Risk Reduction, 24: 485–498.
[https://doi.org/10.1016/j.ijdrr.2017.01.017]

- Central Disaster and Safety Countermeasures Headquarters, and Central Disease Control Headquarters, 2021. Operating Guidelines for the COVID-19 Response Residential Treatment Center.
-
Chen, S., Chen, Q., Yang, J., Lin, L., Li, L., Jiao, L., Geldsetzer, P., Wang, C., Wilder-Smith, A., and Bärnighausen, T., 2021. “Curbing the COVID-19 Pandemic with Facility-based Isolation of Mild Cases: A Mathematical Modeling Study,” Journal of Travel Medicine, 28(2): 1-11.
[https://doi.org/10.1093/jtm/taaa226]

- Chun, B., 2015. “Understanding Emerging Infectious Diseases and How to Prepare and Respond,” HIRA_Policy Trend, 9(5): 38-49.
-
Devi, Y., Patra, S., and Singh, S.P., 2022. “A Location-allocation Model for Influenza Pandemic Outbreaks: A Case Study in India,” Operations Management Research, 15(1–2): 487–502.
[https://doi.org/10.1007/s12063-021-00216-w]

- Ha, K., 2020. “Spatial Interpretation of COVID-19,” Gyeongnam Development, 150: 56-65.
-
Hosseini-Motlagh, S.M., Samani, M.R.G., and Homaei, S., 2023. “Design of Control Strategies to Help Prevent the Spread of COVID-19 Pandemic,” European Journal of Operational Research, 304(1): 219–238.
[https://doi.org/10.1016/j.ejor.2021.11.016]

- Jo, B., 2020. “New Facilities for Managing COVID-19 Infection: Residential Treatment Centers,” Architecture and Urban Space, 38: 10-17
- Kongsomsaksakul, S., Yang, C., and Chen, A., 2005. “Shelter Location-Allocation Model for Flood Evacuation Planning,” Journal of the Eastern Asia Society for Transportation Studies, 6(1981): 4237–4252.
-
Liu, K., Liu, C., Xiang, X., and Tian, Z., 2023. “Testing Facility Location and Dynamic Capacity Planning for Pandemics with Demand Uncertainty,” European Journal of Operational Research, 304(1): 150–168.
[https://doi.org/10.1016/j.ejor.2021.11.028]

-
Liu, Y., Cui, N., and Zhang, J., 2019. “Integrated Temporary Facility Location and Casualty Allocation Planning for Post-disaster Humanitarian Medical Service,” Transportation Research Part E: Logistics and Transportation Review, 128: 1–16.
[https://doi.org/10.1016/j.tre.2019.05.008]

- Pan American Health Organization, 2020. COVID-19 Modeling Exercise.
-
Park, P.G., Kim, C.H., Heo, Y., Kim, T.S., Park, C.W., and Kim, C.H., 2020. “Out-of-hospital Cohort Treatment of Coronavirus Disease 2019 Patients with Mild Symptoms in Korea: An Experience from a Single Community Treatment Center,” Journal of Korean Medical Science, 35(13): 2–7.
[https://doi.org/10.3346/jkms.2020.35.e140]

-
Rautenstrauss, M., Martin, L., and Minner, S., 2023. “Ambulance Dispatching during a Pandemic: Tradeoffs of Categorizing Patients and Allocating Ambulances,” European Journal of Operational Research, 304(1): 39-254.
[https://doi.org/10.1016/j.ejor.2021.11.051]

-
Risanger, S., Singh, B., Morton, D., and Meyers, L.A., 2021. “Selecting Pharmacies for COVID-19 Testing to Ensure Access,” Health Care Management Science, 24(2): 330–338.
[https://doi.org/10.1007/s10729-020-09538-w]

-
Shaker Ardakani, E., Gilani Larimi, N., Oveysi Nejad, M., Madani Hosseini, M., and Zargoush, M., 2023. “A Resilient, Robust Transformation of Healthcare Systems to Cope with COVID-19 through Alternative Resources,” Omega, 114: 102750.
[https://doi.org/10.1016/j.omega.2022.102750]

- Shin, D., 2020, December. “Residential Treatment Centers are Back in Action, Surpassing 60% Operation Rate in 16 Locations,” Medifonews.
-
Sun, H., Wang, Y., and Xue, Y., 2021. “A Bi-objective Robust Optimization Model for Disaster Response Planning under Uncertainties,” Computers and Industrial Engineering, 155(99): 107213.
[https://doi.org/10.1016/j.cie.2021.107213]

-
Taiwo, O.J., 2021. “Maximal Covering Location Problem (MCLP) for the Identification of Potential Optimal COVID-19 Testing Facility Sites in Nigeria,” African Geographical Review, 40(4): 395–411.
[https://doi.org/10.1080/19376812.2020.1838306]

-
Thul, L. and Powell, W., 2023. “Stochastic Optimization for Vaccine and Testing Kit Allocation for the COVID-19 Pandemic,” European Journal of Operational Research, 304(1): 325–338.
[https://doi.org/10.1016/j.ejor.2021.11.007]

-
Verma, A. and Gaukler, G.M., 2015. “Pre-positioning Disaster Response Facilities at Safe Locations: An Evaluation of Deterministic and Stochastic Modeling Approaches,” Computers and Operations Research, 62: 197–209.
[https://doi.org/10.1016/j.cor.2014.10.006]

- Yang, Y., 2020. Residential Treatment Center for Infectious Disease Response Standard Operating Model, National Health Insurance Service Institute of Health Insurance Service.
-
Yang, Y., Kim, H., and Hwang, J., 2020. “Quarantine Facility for Patients with COVID-19 with Mild Symptoms in Korea: Experience from Eighteen Residential Treatment Centers,” Journal of Korean Medical Science, 35(49): 1–10.
[https://doi.org/10.3346/jkms.2020.35.e429]

-
Yin, X., Büyüktahtakın, E., and Patel, B.P., 2023. “COVID-19: Data-driven Optimal Allocation of Ventilator Supply under Uncertainty and Risk,” European Journal of Operational Research, 304(1): 255–275.
[https://doi.org/10.1016/j.ejor.2021.11.052]

- Ministry of Health and Welfare, 2020a, March 1. “Regular Briefing of the Central Disaster and Safety Countermeasure Headquarters on COVID-19,” http://www.mohw.go.kr/react/al/sal0301vw.jsp?PAR_MENU_ID=04&MENU_ID=0403&-CONT_SEQ=353265&page=35&fbclid=IwAR3Z7HRvud7QojF1b_nktTfoAzFA9-43eZFgY2Z1ZCxE1dXI45V8BqDFWwI
- Ministry of Health and Welfare, 2020b, June 19. “Holding a Meeting of the COVID-19 Residential Treatment Center and Partner Hospitals,” https://www.mohw.go.kr/react/al/sal0301vw.jsp?PAR_MENU_ID=04&MENU_ID=0403&page=258&CONT_SEQ=355063&SEARCHKEY=TITLE
- Ministry of Health and Welfare, 2022, March 5. “COVID-19 Domestic Occurrence and Vaccination Status,” https://ncov.kdca.go.kr/tcmBoardView.do?brdId=3&brdGubun=31&-dataGubun=&ncvContSeq=6446&contSeq=6446&board_id=312&gubun=BDJ
- Statistical Geographic Information Service. n.d. “COVID-19 Outbreak and Vaccination Status,” Accessed June 20, 2023. https://sgis.kostat.go.kr/view/thematicMap/thematicMapMain?stat_thema_map_id=sAXkcVzk5V-202007141335257355ued9032uw&theme=CTGR_005&map-Type=05
- WHO, 2023, May 5. “Statement on the Fifteenth Meeting of the IHR (2005) Emergency Committee on the COVID-19 Pandemic,” https://www.who.int/news/item/05-05-2023-statement-on-the-fifteenth-meeting-of-the-international-health-regulations-(2005)-emergency-committee-regarding-the-coronavirus-disease-(covid-19)-pandemic


