Final publication date 18 Oct 2023
The Impacts of Compact City Characteristics on COVID-19 Spreading Force : Focused on the Seoul Metropolitan Area

Abstract
The compact city attempts to address complicated challenges such as traffic congestion, reckless proliferation, and environmental contamination through high-density urban planning, diverse land use, and the activation of public transit. Nonetheless, it has been suggested that the compact city is susceptible to infectious disease disasters due to the increased contact and interaction between individuals in such environments. Consequently, this study intends to objectively investigate how it affects the reproduction number, a measure of COVID-19’s capacity for dissemination, by simultaneously assessing several compact city–specific variables. The results show that the reproduction index exhibited a distinct pattern compared to the COVID-19 spread index from a previous study, and the effect of each characteristic element on the transmission power of COVID-19 was also distinct. The floating population density had a detrimental effect on the spread of COVID-19, while residential density had a positive effect. Among the land-use factors, land-use compaction and urban green-space ratio had a negative influence, whilst the number of bus stops per 1,000 people had a positive effect on the reproduction index.
Keywords:
Compact City, Urban Density, Floating Population, COVID-19, Reproduction Number키워드:
압축도시, 도시밀도, 유동인구, 코로나19, 감염재생산지수Ⅰ. Introduction
1. Background and Purpose of Study
A Compact City is a planning concept that emerged as an alternative to ‘sustainable development’ popularized through the Rio Conference in 1992 to prevent reckless urban sprawl, improve the quality of life of urban residents, increase energy efficiency with reduced flow of activities, and secure environmental sustainability by reducing land destroyed in the process of development (Song and Nam, 2009; Kim and Moon, 2010).
In general, compact cities have been discussed as a positive urban spatial structure in terms of energy efficiency, accessibility, and local economic development (Kim and Ahn, 2011; Cho and Choi, 2013; Lee, 2015; Baek et al., 2016). Recently, however, the Coronavirus disease (COVID-19) hit almost every corner of the world rapidly, to the extent that the World Health Organization declared it a global pandemic. With a surge in the number of confirmed cases and deaths, the pandemic has highlighted the negative aspects of compact cities, which are vulnerable to infectious disease of a large scale due to high level of contact and interaction between people (Lee, 2020; Kim, 2020).
As prevention systems and health services for an infectious disease have some of the greatest impacts on the quality of life of urban citizens, the relation between compact cities and infectious diseases is an important consideration (Chung et al., 2014). Unfortunately, most empirical studies conducted by domestic researchers on the characteristics of compact cities have focused mainly on the spatial structure, environment and economic sector, and only small number of studies have dealt with the relation between compact cities and infectious diseases from an empirical perspective. Furthermore, as focusing on some of the characteristics of compact cities may not be a valid representation of overall compactness of a city, it is necessary to consider the various characteristics of compact cities simultaneously when discussing the relationship between compact cities and epidemics (Baek et al., 2016).
Urban density is one of the key factors used in studies dealing with the correlation between cities and the spread of COVID-19, but the results of those studies as to the urban density are far from consistent. For example, some researchers have argued that higher density of population and public service facilities will affect COVID-19 infection (Shim and Park, 2021; Jo, 2022), while other studies have suggested that architectural and population density contain the spread of COVID-19, and that highly dense area’s subsequent spread is not as rapid as in less densely populated areas (Carozzi et al., 2020; Khavarian-21). Some attributed these conflicting results to differences in how density is measured for the study sites and what types of COVID-19 indicators are used by the authors (Teller, 2021). Inconsistent indicators of the spread of COVID-19 include cumulative confirmed cases and death counts, infection rates and mortality rates. Because of this, a high cumulative number of confirmed and deaths cases are not necessarily indicative of the spread of COVID-19 and comparisons between regions with these indicators are bound to have some limitations. Instead, it is necessary to consider the ‘infection reproduction number,’ which is an important indicator to examine the spread of COVID-19 (Yoo et al., 2021).
Considering that many have raised concerns over whether compact cities are sustainable urban spatial structures in the wake of the recent outbreak of COVID-19, a well-defined empirical approach to investigate this matter is called for. Rather than focusing on a single factor, it is necessary to consider the various characteristics of compact cities together and to suggest indicators that are effective in indicating the spread of COVID-19.
In this regard, this study aims to classify various characteristics of compact cities and conduct empirical analyses on how key characteristics of compact cities have an impact on the spread of COVID-19. For this purpose, we calculated the infection reproduction number, which is an indicator of COVID-19 transmission, based on the number of daily confirmed cases, and selected indicators for each characteristic factor of compact cities based on previous studies. The impact of such characteristics on the spread of COVID-19 was then analyzed using multiple regression modeling.
Ⅱ. Literature Review
1. Compact City
Compact cities are urban spatial structure concepts proposed at the Rio Conference in 1992, where the concept of 'sustainable development' was first defined and recognized and relevant research on sustainable cities began to be actively conducted (Park et al., 2017). Compact cities locate urban functions such as residential, commercial, and business zones within the old centers, encouraging higher population density and mixed-use of land so that reckless urban sprawl is prevented and urban space and infrastructure can be used efficiently. Furthermore, to minimize problems arising from urban sprawl, the urban centers are revitalized reducing the demand for and distance traveled by private vehicles. At the same time, compact cities promote public transportation, walking, and bicycling to lower the energy consumption and environmental pollution (Kim, et al., 2009; Song and Nam, 2009; Kim and Ahn, 2011).
While there is no agreed-upon definition of the characteristics of compact cities, the OECD (2012) suggests that compact cities share three characteristics. First, the compact cities encourage denser development and the use of brownfield site, induce proximate development patterns and preserve greenfield land wherever possible. Second, they resort to a public transport system as much as possible. Third, they promote mixed use of land to make the cities more accessible for the residents, and prefer to make cities accessible by non-motorized means such as walking and cycling (Cho and Choi, 2013).
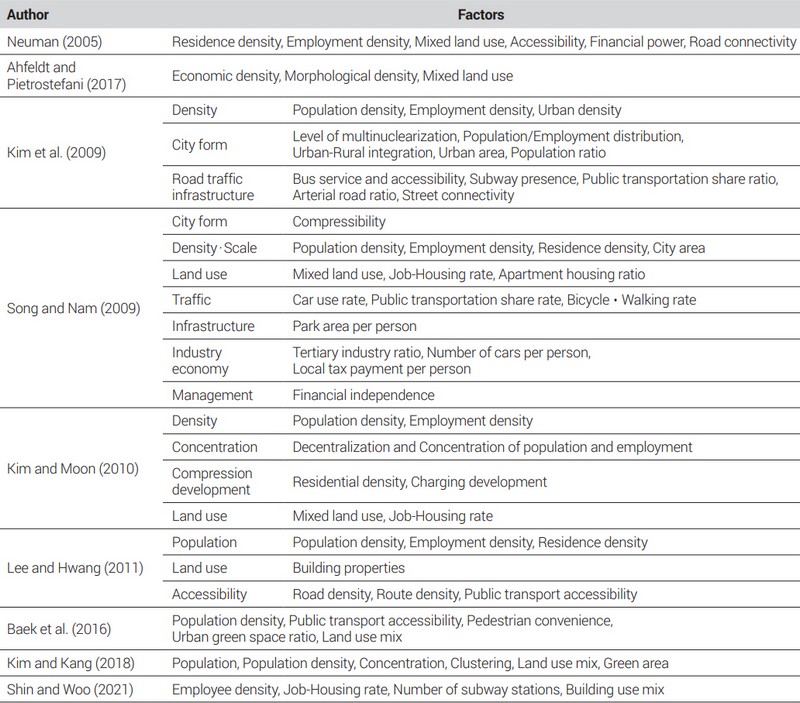
As such, domestic and international researchers have utilized various indicators to represent the characteristics of compact cities, and <Table 1> summarizes the factors characterizing compact cities based on previous studies. As for the overseas studies, Neuman (2005) defined residential and employment density, mixed land use, accessibility, government financial capability, and road connectivity as the main characteristics of compact cities. Ahfeldt and Pietrostefani (2017) classified the characteristics of compact cities into three main categories: 1) Economic density (which represents population and employment density), 2) Morphological density (which represents the density of the architectural environment), and 3) Mixed land use. Among domestic studies, Kim et al. (2009) analyzed the relationship between compact cities and transportation energy consumption and air pollution concentrations, using variables related to density, city forms, and road traffic infrastructure as spatial structure characteristics of compact cities. Song and Nam (2009) used certain characteristic factors of compact cities, including compact city form, high density, mixed land use, proximity to work, promoted use of public transportation, green area, urban management conditions, and economic level, etc., to analyze the relationship between compact cities and transportation energy consumption. To examine the relationship between compact cities and social sustainability, Kim and Moon (2010) used density, spatial structure, proximity to work, promoted use of public transportation, green space, provision of infrastructure, and self-reliance as characteristic factors of compact cities. Lee and Hwang (2011) used variables related to population, land use, and transportation accessibility as indicators of compact cities to evaluate the compactness of urban spatial structure. Baek et al. (2016) used population density, public transport accessibility, pedestrian convenience, urban green space ratio, and land use mix as compact urban planning factors to examine the correlation between compact cities and regional innovation. Kim and Kang (2018) used total population, population density, concentration of population distribution, clustering of densely populated areas, land use mix, and size of green areas as factors of compact spatial structure to examine the impact of compact spatial structure characteristics on urban thermal environment. Shin and Woo (2021) used employee density, job-housing rate, number of subway stations, and mix of building uses as factors of compact cities to examine the relations between commuting networks and compactness indicators.

Indicators measuring compact city
As such, previous studies conducted by different scholars on various topics around the compact cities showed no consensus as to the definition of compact cities’ characteristics, but the main characteristics used by many researchers included population-related density factors, land use, and access to public transport. Although some studies have been conducted on the relation between compact city characteristics and specific sectors such as economy, environment, spatial structure, and sustainability, studies that examined the relation between compact cities and infectious diseases were nothing but insufficient.
2. Impact of Urban Factors on Spread of COVID-19
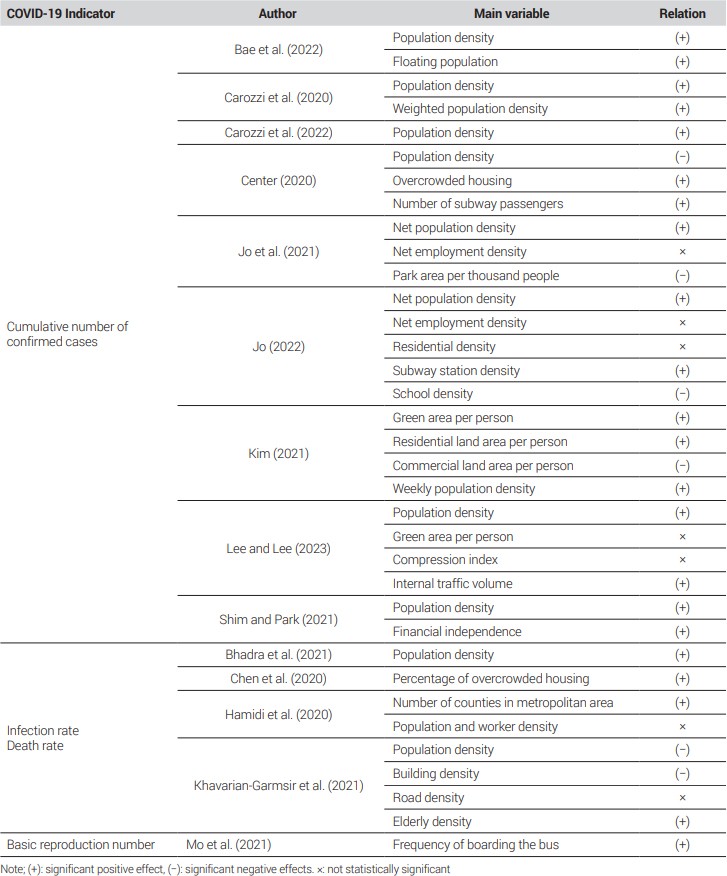
In previous studies on the outbreak and spread of COVID-19, globalization, diversified means of transport, and urban factors were mentioned as the main causes of the spread of the virus (Sung, 2020). Among these, we reviewed literature that examined the impact of certain urban factors of compact cities, including density, land use, and public transport, on the spread of COVID-19. <Table 2> shows the COVID-19 spread indicators and urban factors affecting the spread of COVID-19 used by different authors.
The relationships between urban factors and the spread of COVID-19
As shown in <Table 2>, there were conflicting opinions among researchers about what kind of impact the high urban density has on the transmission of COVID-19. A number of studies have argued that high-density cities are vulnerable to the spread of COVID-19 because the higher the density of a city, the more frequent the contact between people and the more difficult it is to maintain a certain distance due to active social activities and congestion within the space (Bhadra et al., 2020; Carozzi et al., 2020; Lee et al., 2020; Kim, 2021; Shim and Park, 2021; Bae, 2022; Oh, 2022; Jo, 2022; Lee and Lee, 2023). On the other hand, some studies have shown that higher urban densities reduce the spread of COVID-19 due to better access to quality healthcare services and facilities and higher compliance with policies such as social distancing; according to these studies, urban connectivity has a greater impact on the spread of COVID-19 than density, and that the impact of urban density on the spread of COVID-19 varies by time period (Hamidi et al., 2020; Khavarian-Garmsir et al., 2021; Carozzi et al., 2022). Khavarian-Garmsir et al. (2021) argued that population structure has a greater impact on the spread of COVID-19 than population density, limiting the extent to which urban density can be considered a major risk factor for the spread of COVID-19. Carozzi et al. (2022) found that high urban density could affect the early spread of COVID-19, but not the subsequent transmission, which they attributed to policies such as vaccination and social distancing, as well as a sharp decline in mobility via public transportation.
Land use is one of the fundamental factors in spatial planning that determines the flow of people and is closely related to the speed and scale of transmission of an infectious disease (Lee et al., 2020). Literature on land use and the spread of COVID-19 has mainly focused on green space and parks and residential areas, and studies on the relationship between green space and parks and the spread of COVID-19 have thus far shown conflicting results. Some studies have found that park area is an important urban factor in the post-COVID-19 era with an increased merit of visiting parks, as larger park areas help contain the spread of COVID-19 (Jo et al., 2021; Jo, 2022). On the other hand, Kim (2021) has argued that the larger the small parks and green spaces are, the greater the spread of COVID-19, suggesting that green spaces do not function as quarantine buffers that physically prevent the spread of infectious diseases among people. As for residential areas, studies have focused on overcrowding, arguing that the spread of COVID-19 is more accelerated in high-rise and high-density residential areas (Chen et al., 2020; Center, 2020; Kim, 2021).
As a last factor reviewed, some studies suggested that public transport nodal points are high-risk spaces for collective infection of COVID-19 and that urban connectivity, rather than density, is a key factor in the spread of COVID-19. Mo et al. (2021) argued that movement within or between regions is a catalyst for the spatial spread of COVID-19, increasing the risk of random contacts and thus transmitting infectious disease, while Jo (2022) suggested that higher subway station density affects the spread of COVID-19 due to the commercial and public service facilities packed around the station area. In addition, Hamidi et al. (2020) and Jo et al. (2021) found that the spread of COVID-19 was faster in areas with a large influx of people regardless of the density of the city, suggesting that urban connectivity is a more important indicator for the spread of COVID-19 than population density.
Reviews on previous studies dealing with COVID-19 show that various urban factors affect the spread of COVID-19, and many studies have used the cumulative number of confirmed cases and infection rates as indicators of the spread of COVID-19. However, domestic and overseas scholars have conflicting opinions as to the impact of density-related indicators on the spread of COVID-19. For the cause of this difference, Teller (2021) pointed out inconsistent COVID-19 spread indicators and density measurement methods, as well as differences in COVID-19 testing and policies across countries. Lee et al. (2020) also mentioned the limitations of confirmed cases data aggregated based on the area of residence of the infected.
Therefore, it is necessary to consider indicators that can easily compare regions and show the intensity of COVID-19 spread, and an analytic approach that consider indicators for dynamic floating population density is needed, in addition to traditional resident population density.
3. Infection Reproduction Number
The Infection Reproduction Number (R) is defined as the number of secondary infections that an infected person in a population can cause, on average, within the period of possible transmission, and if R is greater than 1, it means that the epidemic is continuing due to the spread of infectious diseases within the population. The infection reproduction number is divided into basic reproduction number (R0) and effective reproduction number (Re). The basic reproduction number is an indicator of the biological infectiousness of an infectious disease in the early stages of an outbreak when disease control and intervention measures have not yet been introduced, while the effective reproduction number is an indicator that takes into account personal preventive measures and relevant policy implementation during the ongoing epidemic following the initial pattern of an outbreak, and is used to track changes in infectiousness over time or to determine the short-term effects of the interventions. As such, calculating these numbers is important for evaluating the effectiveness of disease prevention policies and monitoring the transmission of the infections (Yoo et al., 2021).
In this study, we use the time-varying reproduction number (Rt) which is a type of effective infection reproduction number. This indicator shows the average infectiousness of population at a given point and can be calculated repeatedly using the instantaneous reproduction number method suggested by Cori et al. (2013) using the number of confirmed cases and infectiousness (Cori et al., 2013; Jung et al., 2020; Yoo et al., 2021). To calculate the number, we used the number of daily confirmed cases data and the generation time or serial interval, indicating infectivity. <Figure 1> is an example of serial intervals, which is estimated with the difference between the date of symptom onset of a source of infection and the infected person. Since the serial interval data differs for each infectious disease, this study applied the assumption by the Pan-American Health Organization (PAHO), which estimated that the serial interval of COVID-19 follows a gamma distribution with an average of 4.8 days and a standard deviation of 2.3 days (Moon et al., 2020; Yoo et al., 2021).

Serial interval (example)Source: Modified from Jeong et al.(2020)
4. Findings
Based on the review on previous studies, our first finding is that there is no clear definition of compact city characteristics, but density, land use, and access to public transportation have been commonly used indicators to evaluate the compactness of a city. Given that, various characteristics of compact cities should be considered together. Second, there are many urban factors affecting the spread of COVID-19, but the results for each factor are not consistent across studies, which may be attributable to differences in COVID-19 spread indicators, factor measurement methods, time periods, and countries. This raises the need to consider dynamic density indicators to compensate for the limitations of resident population density data utilized in existing studies and to address the inconsistent findings. Third, many COVID-19-related studies have used cumulative confirmed case counts and infection rates as indicators of the spread of COVID-19, but these data have limitations in properly representing the infectiousness of COVID-19 and may not be easily comparable across regions.
Therefore, this study takes a different approach from the existing studies; we classify urban factors as characteristic factors of compact cities, consider the density of floating population instead of resident population, and utilize the infection reproduction number, which is an indicator of COVID-19 transmission. By doing so, this study aims to analyze the impact of urban characteristics of compact cities on the spread of COVID-19.
Ⅲ. Methodology
1. Process and Scope
The purpose of this study is to empirically analyze the impact of compact city characteristics on COVID-19 transmission. First, we calculated the average instantaneous infection reproduction number for each site based on the daily confirmed case counts provided by the local government data portals. Second, based on previous studies, we selected three characteristics of compact cities: density, land use, and access to public transportation facilities. Finally, we empirically analyzed the impact of compact city characteristics on the spread of COVID-19 through multiple regression analysis, by setting the average instantaneous infection reproduction number as the dependent variable and compact city characteristics as the independent variable.
The spatial scope of the study was the Seoul metropolitan area, as the number of cases in metropolitan areas was significantly higher than non-metropolitan areas; it takes up about 70% of the total, based on the cumulative number of COVID-19 cases by city across the country as of the 4th wave of COVID-19 epidemic (Figure 2). The spatial unit was set to Si/Gun/Gu (unit names of Korea’s administrative district system) in the Seoul metropolitan area where data was available, but Ongjin-gun, Incheon, was excluded due to its geographic characteristics as an island. The temporal scope is focused on the 4th wave of COVID-19 epidemic (Ministry of Health and Welfare, 2023), and, considering the calculation process of the real-time infection reproduction number and the lack of data on confirmed cases in Incheon Metropolitan City, the subject time frame was set to 201 days, from June 30, 2021, to January 17, 2022.

Cumulative number of COVID-19 casesSource: SGIS, reconstruction
The real-time infection reproduction number used in this study is an indicator of the spread of COVID-19 that captures the short-term effects of a sustained epidemic (Yoo et al., 2021), and the number of COVID-19 confirmed cases in the Seoul metropolitan area during the 4th wave increased by about five times compared to the previous epidemic waves. In addition, the spread of the delta variant during the 4th wave led to an increase in collective infections as well as infections by individual or small-scale contacts (Ha et al., 2023). Considering the characteristics of epidemic periods and the COVID-19 spread indicators, the 4th epidemic period (‘the 4th Wave’) was set as the temporal scope of this study. <Figure 3> is a graph that visualizes the trend of the number of daily confirmed cases in Seoul, Incheon City, and Gyeonggi-do Province for the four epidemic periods since the outbreak of the COVID-19.

Daily number of confirmed cases
2. Variables and Model Selection
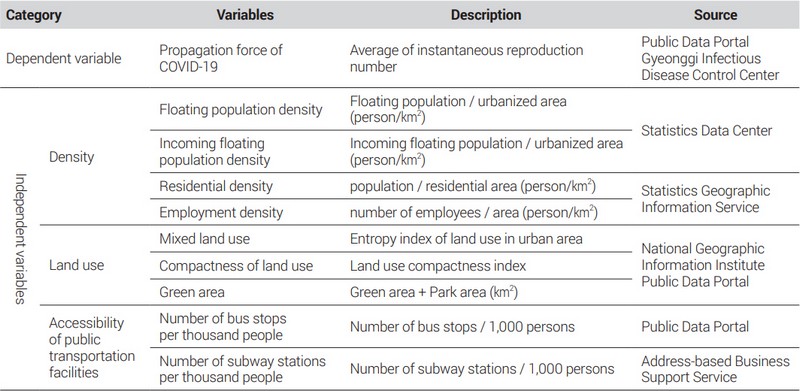
The average instantaneous infection reproduction number (Rt) indicative of COVID-19 propagation force, is set as a dependent variable calculated by Cori’s instantaneous reproduction number method, and in consideration of the previous studies, the characteristics of compact cities are set as independent variables, which include density variables, land use variables, and accessibility to public transportation facility variables, as shown <Table 3>.
| (1) |
Variables used in the model
The dependent variable, the average instantaneous infection reproduction number, is the arithmetic mean of the instantaneous infection reproduction number data at a series of specific points in the study's temporal range. In Equation (2), the instantaneous infection reproduction number is calculated by dividing the daily number of confirmed cases at t by the daily number of confirmed cases and infectiousness at t and earlier, using Cori's methodology. W(s) means the current infectiousness as of s and to estimate it, we used serial interval data, which represents the period from the date of onset of an infected person to the date of onset of a second-infected person. For the serial interval data, we used gamma distribution assumptions, which suggest an average of 4.8 days of serial interval and a standard deviation of 2.3 days, as proposed by PAHO (Ahn and Kwon, 2021). In order to facilitate the calculation processes above, this study utilized the EpiEstim, the R package developed by Cori, to calculate the daily instantaneous infection reproduction number, and the average value of the sum of the instantaneous infection reproduction number divided by the total number of days was used as an indicator of COVID-19 transmission for each administrative district (Si/Gun/Gu).
| (2) |
As independent variables in this study, we used density variables related to population factors, such as floating and incoming floating population density, residential density, and employment density. The floating and incoming floating population density for each administrative district was calculated with the average daily inflow population in or out of each district per kilometer based on the area of the city, using the telecommunication mobile population flow statistics provided by the Statistics Korea as Experimental Statistics No. 2021-001. As for the floating population used in this study, if a resident of District A traveled within the same district and stayed there for more than 30 minutes, such resident belongs to the ‘Floating population of District A’; if a resident of District B traveled to District A and stayed there for more than 30 minutes, the resident belongs to the ‘Incoming floating population of District A’. As such, the floating and incoming floating population density are set as independent variables to address the limitations lying in employing the existing resident population density, as pointed out in previous studies (Teller, 2021; Lee et al., 2020), and, at the same time, to fulfill the need to consider more dynamic density indicators. Residential and employment density were set as independent variables considering previous studies (Neuman, 2005; Lee and Hwang, 2011) that characterized compact cities as having high residential and employment density. Residential density was calculated with the number of residents registered as of 2021 per square kilometer for the area of residential districts, taking into account the previous studies suggesting that overcrowded housing affects the spread of COVID-19 (Center, 2020; Chen et al., 2020), and employment density was calculated with the number of employees registered in 2021 per square kilometer based on the area of administrative districts.
The land use variables were mixed land use, compactness of land use, and green area. The land use mix was calculated by deriving the entropy index for residential, commercial, industrial, and green areas in a city to assess the level of mixed use of land. Entropy is a concept mainly used as a measure of disorder in thermodynamics; the closer it is to 1, the higher the land use mix. It was set as an independent variable considering the study by Kim and Kang (2018) suggesting that it decently reflects the characteristics of compact cities. The mixed land use calculation formula is shown in Equation (3).
| (3) |
Compactness of land use is an indicator developed by Lee et al. (2021) to measure how compact land use is. The index is called the Land Use Compactness Index (LCI), which shows how many different buildings are concentrated in a limited space by employing building floor area and usage data for a 500-meter square grid. This indicator is a normalized average of the Building Density (BD) and Building Mixed Use (BM) and has a value between 0 and 1. The higher the value, the more compact the land use is. The land use compactness can be calculated as shown in Equation (4).
| (4) |
The Building Density (BD) used in the compactness index refers to the degree to which buildings are densely and intensively used and is calculated as the floor area ratio multiplied by the area without buildings to the ratio of the total grid area, as shown in Equation (5). The Building Mixed Use (BM) means the degree to which different building uses are mixed within a limited spatial range; the ratio is calculated with the number of grids with different uses exceeding a certain level to the number of grids with buildings, as shown in Equation (6).1)
| (5) |
| (6) |
The green area is an indicator that combines the area of green areas and parks among the use areas; it was set as an independent variable considering the previous study (Baek et al., 2016) suggesting that compact cities are an important indicator as the urban spatial structure concept that emerged to solve environmental problems such as low-density development and morphological sprawl.
For the public transportation accessibility variables, the number of bus stops per thousand people and the number of subway stations per thousand people were used. Each variable was calculated as the number of bus stops and subway stations per thousand people based on the resident population of the applicable Si/Gun/Gu. These numbers were included as independent variables in consideration of previous studies (Kim et al., 2009; Kim and Ahn 2011; Shin and Woo 2021) showing that compact cities reduce the demand for private cars and promote public transportation in order to save energy consumption and reduce environmental pollution, and areas with more public transport infrastructure have higher accessibility to public transportation.
Ⅳ. Results
1. COVID-19 Transmission Force Indicators
In this study, the average instantaneous infection reproduction number for the 4th wave of COVID-19 epidemic was calculated for the cities, counties and districts (‘Si/Gun/Gu’) in the Seoul metropolitan area. <Figure 4> shows a comparison between the instantaneous infection reproduction number (‘Reproduction number’), the cumulative number of confirmed cases and infection rate during the 4th wave of epidemic, which were used as indicators for the COVID-19 spreading in previous studies. As for the average reproduction number, Ganghwa-gun, Incheon, was the highest at 1.488, and Dongdaemun-gu, Seoul, was the lowest at 0.960. Regarding the cumulative number of confirmed cases, on the other hand, Songpa-gu, Seoul, had the highest number with 627,345 and Yeoncheon-gun, Gyeonggi-do, had the lowest with 605, while the infection rate was highest at 3.45% in Jung-gu, Seoul, and lowest at 0.76% in Gwonsun-gu, Suwon, Gyeonggi-do. As such, the reproduction number used in this study as an indicator of the spread of COVID-19 has different aspects from the cumulative number of confirmed cases and infection rate indicators used in previous studies; this implies that the impact of compact city characteristics on the spread of COVID-19 may also be different from what have been observed in the previous studies

Comparison of COVID-19 indicators during the 4th wave of COVID-19
2. Basic Statistical Analysis
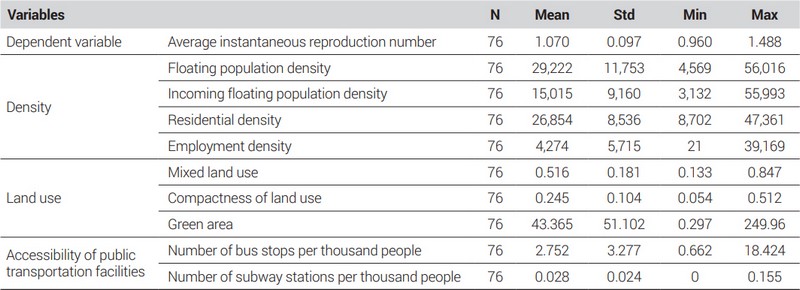
<Table 4> shows the basic statistical analysis of the variables used in the modeling process. The average instantaneous infection reproduction numbers stand at 1.070, with the highest value in Ganghwa-gun, Incheon (1.488), followed by Yeoncheon-gun, Gyeonggi-do (1.349), and Dong-gu, Incheon (1.321); the lowest number was found in Dongdaemun-gu, Seoul (0.960), followed by Nowon-gu (0.961) and Seongbuk-gu (0.961), Seoul. When compared to the cumulative number of confirmed cases, the opposite pattern was observed, indicating that a high number of confirmed cases does not necessarily mean the epidemic of COVID-19.
Descriptive statistics
Among the density variables in the independent variables category, the average density of floating population in Si/Gun/Gu was 29,222 (no.of persons/km2), and with Nowon-gu, Seoul (56,016) at the highest, followed by Jungnang-gu (50,956) and Yangcheon-gu (48,009), Seoul. The average density of incoming floating population was 15,015 (no. of persons/km2), with the highest in Gangnam-gu, Seoul (55,993), followed by Jung-gu (52,581), and Jongno-gu (34,781), Seoul. The residential density was averaged 26,854 (no. of persons/km2), with Yeongdeungpo-gu, Seoul (47,361) the highest, followed by Gangseo-gu, Seoul (44,075), and Gyeyang-gu, Incheon (41,174), while the employment density averaged 4,274 (no. of persons/km2), with Jung-gu, Seoul (39,169) the highest, followed by Geumcheon-gu (39,503) and Gangnam-gu (34,312), Seoul. As a visible trend, density variables are generally higher in Seoul.
Among the land use variables, land use mix was found to be 0.516 on average, with the highest figure in Bupyeong-gu, Incheon (0.847), followed by Gwangmyeong-si (0.839), and Siheung-si (0.829), Gyeonggi-do, and with the lowest in Jung-gu, Seoul (0.133), Seodaemun-gu, Seoul (0.163), and Gapyeong-gun, Gyeonggi-do (0.217). Compactness of land use was the highest in Namyangju-si, Gyeonggi-do (0.511), followed by Paju-si, Gyeonggi-do (0.509), and Jung-gu, Seoul (0.5), and the lowest in Ganghwa-gun, Incheon (0.054), followed by Gwacheon-si, Gyeonggi-do (0.066), and Danwon-gu, Ansan-si (0.078). The average green area is 43.37(km2), and was highest at 249.96 in Chaein-gu, Yongin-si, Gyeonggi-do, followed by Hwaseong-si, Gyeonggi-do (246.00) and Namyangju-si, Gyeonggi-do (197.14), while it was the lowest in Jung-gu, Seoul (0.30), followed by Dong-gu, Incheon (0.85), and Dongdaemun-gu, Seoul (1.28), showing generally higher values in Gyeonggi-do and Incheon Metropolitan City.
Among the accessibility to public transportation facilities variables, the number of bus stops per thousand people averaged 2.752 (units/person), and was observed higher in outlying areas in the descending order of Ganghwa-gun, Incheon (18.424), Yangpyeong-gun, Gyeonggi-do (14.536), and Gapyeong-gun, Gyeonggi-do (14.133). As for the number of subway stations per thousand people, it was highest in Jung-gu, Seoul (0.155), followed by Jung-gu, Incheon (0.084), and Jongno-gu, Seoul (0.069) as these areas have relatively low resident populations in general.
3. Multiple Regression Modeling Results
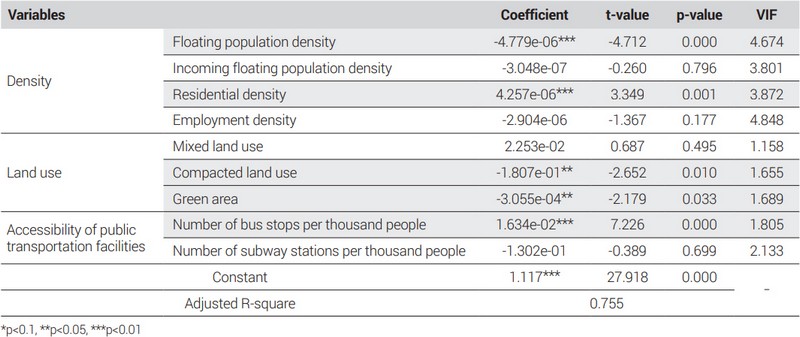
<Table 5> shows the results of the multiple regression modeling. All variables have a Variance Inflation Factor (VIF) of 10 or less, indicating that there is no multicollinearity issue found.
Results of multiple regression analysis
Among the density variables, which are representative indicators of a compact city, the floating population density and residential density variables for each Si/Gun/Gu were found to have a significant impact on the transmission of COVID-19, while the incoming floating population density and employment density that comes from other regions were not statistically significant. As being reviewed earlier, Jo et al. (2021) and Jo (2022) also suggested that employment density was not a significant factor as to an increase of cumulative number of confirmed cases.
First, among the floating population densities introduced from the previous studies (Teller, 2021; Lee, 2020) suggesting that it is necessary to consider more dynamic density indicators and limitations existing in resident population density when explaining the spread of COVID-19, the floating population density in Si/Gun/Gu was found to have a significant negative effect on the reduction of COVID-19 propagation force, but the incoming floating population density was not statistically significant. This finding is consistent with Hamidi et al. (2020) and Khavarian-Garmsir et al. (2021), who found that population density had no effect on the spread of COVID-19, but contrary to a number of other previous studies showing that resident and daytime population density and traffic flow density had a significant impact on the spread of COVID-19 (Bhadra et al, 2021; Carozzi et al., 2020; Jo et al., 2021; Lee et al., 2020; Kim, 2021; Shim and Park, 2021; Bae et al, 2022; Oh, 2022; Jo, 2022; Lee and Lee, 2023). Considering the temporal range of the study and previous studies showing that the ‘lock-down’ policies (i.e. school and workplace shutdowns, public event cancellations, public transportation disruptions, and movement restrictions) reduced infection reproduction number, these findings can be attributable to the nationwide vaccination rates reached 70% during the 4th wave of the pandemic, and the social distancing policies that implemented remote working/classes and gathering restrictions (Han and Park, 2021; Yang et al, 2022). Also, the reduced mobility of urban residents compared to the pre-COVID-19 periods can also be a reason why high density did not affect the spread of COVID-19 during the later epidemic wave (Carozzi et al., 2022). On the other hand, residential density was found to have a significant effect on the increase in COVID-19 propagation force, suggesting that a large number of residents in a residential district can affect the spread of COVID-19. These results are consistent with studies showing that overcrowded housing affects the spread of COVID-19 (Center, 2020; Chen et al., 2020; Kim, 2021).
As such, the representative density variables of compact cities showed quite inconsistent trends, which suggests that the impact of density may vary depending on the timing of the COVID-19 epidemic, the number of confirmed cases, and the severity of the transmission power of the virus, and that the type of density measurement used can also make a difference in results. Furthermore, given the limitations in counting COVID-19 cases by residence rather than by source of infection, caution should be taken in interpreting the relationship between high-density compact cities and COVID-19.
Second, in terms of land use variables, the compacted land use and green area were found to have a significant effect on reducing COVID-19 transmission; this can be interpreted that the more compact the land use, the more diverse the use of buildings in the zone, and the larger the area of green space and parks, the lower the COVID-19 propagation power. These results contradict studies that have shown that green spaces do not play a role in preventing human-to-human transmission of infectious diseases (Kim, 2021), but are consistent with studies suggesting that parks are important urban factors in the post-COVID-19 era as they help curb the spread of COVID-19 (Jo et al., 2021; Jo, 2022).
As such, the compacted use of land to prevent the urban sprawl, and the expansion and proper placement of open spaces such as green areas and parks, which served as a ‘buffer zone’ to prevent the spread of COVID-19 in high-density environments, can help create a safe urban environment; this can be interpreted that compact land use would be effective in the post-COVID-19 era (Lee, 2020). Nevertheless, a cautious approach is needed because the green area and parks can facilitate the spread if a large number of people use those at the same time (Chen et al., 2020).
Finally, the public transportation facility accessibility variables show that the number of subway stations per thousand people is not statistically significant, but the number of bus stops per thousand people has a significant impact on the increase in COVID-19 transmission power. These results are consistent with previous studies suggesting that 1) public transportation facilities have an impact on the spread of COVID-19, 2) mobility serves as a risk factor for the transmission of the disease by facilitating the spatial spread of COVID-19 and increasing the frequency of human-to-human contact; and 3) connectivity, rather than urban density, is a major factor in the spread of COVID-19 (Mo et al., 2021; Hamidi et al., 2020; Jo et al., 2021; Jo, 2022). However, given that the decreased use of public transportation due to COVID-19 is exacerbating the profitability of public transport business and increasing the financial burden on public and private sectors, measures to promote safe public transportation usage is needed, including stricter bus disinfection, contactless systems, transportation demand and congestion management, facility hygiene control, and innovative ventilation systems (Mo et al., 2021; Kim, 2020; Bin and Son, 2021).
Ⅴ. Conclusions
Compact cities have emerged as an urban planning concept to solve complex problems such as traffic congestion, reckless urban sprawl, and environmental pollution caused by rapid growth of a city, and is an urban spatial structure to secure environmental sustainability and improve energy efficiency for sustainable development. However, the COVID-19 pandemic has raised questions about whether compact cities are sustainable urban spatial structures. Against this background, urban factors have been mentioned as a major cause of the spread of infectious diseases, but there were limitations in the COVID-19 indicators used in previous studies, and empirical studies on the relationship between compact cities and infectious diseases are relatively scarce. Therefore, this study analyzed the impact of compact city characteristics on the instantaneous infection reproduction number, an indicator of the spread of the virus during the 4th wave of the epidemic.
The results show that the instantaneous infection reproduction number has a different pattern compared to the cumulative number of confirmed cases and infection rates used in previous studies. This means that a high number of cumulative confirmed cases in a particular area does not indicate an epidemic of COVID-19. In addition, among the density variables of compact cities, the floating population density of an administrative district has a negative effect on the transmission of COVID-19, but residential density has a positive effect. This suggests that density may not affect the subsequent spread of COVID-19 due to high vaccination rates and implementation of relevant policies such as social distancing during the 4th wave of COVID-19, but overcrowding can still be considered vulnerable to the transmission of the virus, so caution is needed in interpreting the relationship between compact cities and COVID-19. Among the land use variables, compacted land use and green area were found to have a negative impact, suggesting that compact land use and green space provision will remain effective in the post-COVID-19 era. However, among the public transportation accessibility variables, the number of bus stops per thousand people was found to have a positive effect, suggesting that connectivity is more vulnerable to the spread of COVID-19 than urban density.
The implications and limitations of this analysis can be summarized as follows.
First, this study utilized the instantaneous infection reproduction number, which has not been used in previous studies, and suggested that a high cumulative number of confirmed cases does not necessarily indicate the continuation of the COVID-19 epidemic in that region. Therefore, when analyzing the relationship between urban factors and infectious diseases, the instantaneous infection reproduction number should be considered in addition to the confirmed cases counts.
Second, in the wake of COVID-19, a dichotomous approach as to whether compact cities are a sustainable planning concept or not should be avoided; more importantly, it is necessary to analyze the correlation between various compact city characteristics and infectious diseases to establish effective urban plans to more effectively respond to infectious diseases in the post-COVID-19 era. Regarding density indicators, different indicators showed different results, indicating that it is hard to conclude that compact cities are vulnerable to the spread of COVID-19 simply because of its high density. In the case of land use and public transportation accessibility indicators, the more compact land use and the more open spaces secured were found to suppress the spread of COVID-19, but high public transportation accessibility was a factor that increases the spread of COVID-19. This suggests that in future urban planning for a city of compact nature, employing compact land use and securing open space to avoid reckless urban sprawl should be considered as an effective concept in the post-COVID-19 era, but it is also important to maintain appropriate density level for cities, and to establish policies to make it safe to use public transportation, rather than ones that curb the usage of it.
Finally, the temporal scope of this study focuses on the 4th wave of COVID-19 epidemic, and there existed some limitations in obtaining data on COVID-19 and potential disturbance factors. While the 4th wave was a period where small-scale and individual contacts spread infections across the Seoul metropolitan area, factors that led to the spread of COVID-19 may differ for each wave. We haven’t looked into the effect of temperature and government policies, which can also be a limitation of this study. In addition, it was difficult to obtain data on personal information of patients confirmed with COVID-19, places of confirmation, vaccination rates, and the proportion of foreigners, which made it impossible to carry out more detailed segmentation, and potential disturbance factors have also not been considered. Later studies utilizing micro-spatial units (i.e. ‘Dong’, the smallest administrative unit in the Seoul metropolitan area), specific location of infection, and time series data, if conducted, can help evaluate various indicators of compact cities for each epidemic wave of the COVID-19 pandemic.
Acknowledgments
This work is supported by Korea Ministry of Land, Infrastructure and Transport (MOLIT) as 「Innovative Talent Education Program for Smart City」.
This work was supported by the Ministry of Education of the Republic of Korea and the National Research Foundation of Korea (NRF-2018S1A5A2A03030264).
References
- Ahfeldt, G.M. and Pietrostefani, E., 2017. The Compact City in Empirical Research: A Quantitative Literature Review, Spatial Economics Research Centre(SERC) Discussion Papers, 215.
-
Ahn, S.J. and Kwon, M.H., 2021. “COVID-19 Forecast System Based on Instantaneous Reproduction Numbe”, Paper presented at the Korea Communications Society Conference, Jeju Ramada Plaza Hotel, 1017-1018.
안수진·권민혜, 2021. “순간 재생산지수에 기반한 COVID-19 확진자 수 변화 예측 시스템 연구”, 한국통신학회 학술발표회, 제주라마다플라자호텔, 1017-1018. -
Bae, M.K., Cho, T.H., and Oh, H., 2022. “Analysis of the Effect of Infection Vulnerable Factors of Local Governments on the Occurrence of COVID-19 Confirmed Patients in Korea”, Korean Journal of Convergence Science, 11(7): 121-137.
[
https://doi.org/10.24826/KSCS.11.7.8
]

배민기·조택희·오후, 2022. “지자체의 감염 취약요인이 코로나19 확진자 발생에 미치는 영향 분석”, 「한국융합과학회지」, 11(7): 121-137. -
Baek, S.M., Wang, P., and Kang, M.K., 2016. “A Study on the Impact of Compact City Characteristics on Regional Innovation”, Paper presented at the Korean Regional Development Association Conference, Seoul: Chung-Ang University, 423-436.
백선미·왕붕·강명구, 2016. “압축도시 특성요인 지역혁신에 미치는 영향에 관한 연구”, 한국지역개발학회 추계종합학술대회, 서울: 중앙대학교, 423-436. -
Bhadra, A., Mukherjee, A., and Sarkar, K., 2021. “Impact of Population Density on Covid-19 Infected and Mortality Rate in India”, Modeling Earth Systems and Environment, 7: 623-629.
[https://doi.org/10.1007/s40808-020-00984-7]
-
Bin, M.Y. and Son, S.K., 2021. “Finding an Alternative with COVID-19 in the Context of COVID-19 and Changes in Bus Use”, Gyeonggi Research Institute Issue & Diagnosis, 461: 1-24.
빈미영·손슬기, 2021. “코로나19 상황 버스이용 변화에서 위드 코로나 대안을 찾다”, 「경기연구원 이슈&진단」, 461: 1-24. -
Carozzi, F., Provenzano, S., and Roth, S., 2020. Urban Density and COVID-19, IZA Discussion Paper No. 13440.
[https://doi.org/10.2139/ssrn.3643204]
-
Carozzi, F., Provenzano, S., and Roth, S., 2022. “Urban Density and COVID-19: Understanding the US Experience”, The Annals of Regional Science, 1-32.
[https://doi.org/10.1007/s00168-022-01193-z]
- Center, N.F., 2020. “COVID-19 Cases in New York City, a Neighborhood-Level Analysis”, The Stoop: NYU Furman Center Blog.
- Chen, J.T., Waterman, P.D., and Krieger, N., 2020. “COVID-19 and the Unequal Surge in Mortality Rates in Massachusetts, by City/Town and ZIP Code Measures of Poverty, Household Crowding, Race/Ethnicity, and Racialized Economic Segregation”, Harvard Center for Population and Development Studies, 19(2): Working Paper Series.
-
Cori, A., Ferguson, N.M., Fraser, C., and Cauchemez, S., 2013. “A New Framework and Software to Estimate Time-Varying Reproduction Numbers During Epidemics”, American Journal of Epidemiology, 178(9): 1505-1512.
[https://doi.org/10.1093/aje/kwt133]
-
Ha, J.H., Lee, J.Y., Choi, S.Y., and Park, S.K., 2023. “COVID-19 Waves and Their Characteristics in the Seoul Metropolitan Area(Jan 20, 2020~Aug 31, 2020)”, Public Health Weekly Report, 16(5): 111-136.
하진호·이지연·최소영·박숙경, 2023. “수도권 코로나19 발생 현황과 특성(2020.1.20.~2022.8.31.)”, 「주간 건강과 질병」, 16(5): 111-136. -
Hamidi, S., Sabouri, S., and Ewing, R., 2020. “Does density aggravate the COVID-19 pandemic? Early findings and lessons for planners.” Journal of the American Planning Association, 86(4): 495-509.
[https://doi.org/10.1080/01944363.2020.1777891]
-
Han, C.Y. and Park, S.A., 2021. “The Effect of the Containment and Closure Policies on the Spread of COVID-19”, Journal of The Korea Association for Policy Studies, 30(3): 1-38.
[
https://doi.org/10.33900/KAPS.2021.30.3.1
]
한창연·박순애, 2021. “코로나19 바이러스 감염 확산에 대응한 봉쇄 및 폐쇄정책의 효과 분석”, 「한국정책학회보」, 30(3): 1-38. -
Jeong, G.S., Park, G.Y., and Lee, J.H., 2014. “Priority Analysis of Core Compact City Indicators Incorporating the Preventive Planning Factors Against Urban Disaster”, Journal of the Korean Society of Hazard Mitigation, 14(3): 9-20.
[
https://doi.org/10.9798/KOSHAM.2014.14.3.9
]
정광섭·박규용·이주형, 2014. “방재적 계획요인을 반영한 압축도시 핵심지표의 중요도 분석”, 「한국방재학회논문집」, 14(3): 9-20. -
Jeong, J.W., Kwon, H.M., Hong, S.H., and Lee, M.K., 2020. “Estimation of Reproduction Number of COVID-19 in Korea”, Journal of Korean Society for Quality Management, 48(3): 493-510.
정재웅·권혁무·홍성훈·이민구, 2020. “국내 코로나바이러스감염증-19의 감염재생산수 추정”, 「품질경영학회지」, 48(3): 493-510. -
Jo, Y., 2022. “Evaluation of Urban Density Vulnerability and Its Changing Importance During the COVID-19 Pandemic : Focused on the Seoul Metropolitan Area”, Master’s Degree Dissertation, Hanyang University.
조윤, 2022. “COVID-19 팬데믹 상황에서의 도시 밀도 취약성 평가와 중요도 변화”, 한양대학교 석사학위논문. -
Jo, Y.A. and Choi, M.H., 2013. “Empirical Study on the Optimum Urban Density for 74 Autonomous Districts of the Metropolitan Cities”, The Korean Journal of Local Government Studies, 17(3): 47-66.
조윤애·최무현, 2013. “압축도시와 적정 개발밀도에 관한 실증연구”, 「지방정부연구」, 17(3): 47-66. -
Jo, Y., Hong, A., and Sung, H., 2021. “Density or Connectivity: What Are the Main Causes of the Spatial Proliferation of COVID-19 in Korea?”, International Journal of Environmental Research and Public Health, 18(10): p.5084.
[https://doi.org/10.3390/ijerph18105084]
-
Khavarian-Garmsir, A.R., Sharifi, A., and Moradpour, N., 2021. “Are High-Density Districts More Vulnerable to the COVID-19 Pandemic?”, Sustainable Cities and Society, 70: p.102911.
[https://doi.org/10.1016/j.scs.2021.102911]
-
Kim, D.G., 2020. “In the Post-COVID-19 era, The Direction of Urban Planning to Respond to Infectious Diseases”, Korea Research Institute for Human Settlements Issue Report, No.17.
김동근, 2020. “포스트 코로나 시대, 감염병 대응형 도시계획 방향”, 「국토연구원 국토이슈리포트」, 제17호. -
Kim, H.C. and Ahn, K.H., 2011. “The Effects of Compact City Planning Strategies on Commuting Distance of Different Income Levels: focused on Seoul, Korea”, Journal of the Urban Design Institute of Korea: Urban Design, 12(1): 55-70.
김희철·안건혁, 2011. “압축도시 계획요소가 소득계층별 통근거리에 미치는 영향”, 「한국도시설계학회지: 도시설계」, 12(1): 55-70. -
Kim, J.H., 2021. “A Study on the Factors Influencing the Spread of COVID-19 in Urban Area : Focusing on the Types of Urban Facility in Seoul Metropolitan Area”, Master’s Degree Dissertation, Seoul National University.
김정호, 2021. “도시지역 내 COVID-19 확산 영향요인에 관한 연구”, 서울대학교 대학원 석사학위논문. -
Kim, J.S. and Kang, J.E., 2018. “Effects of Compact Spatial Characteristics on the Urban Thermal Environment”, Journal of the Urban Design Institute of Korea: Urban Design, 19(1): 21-36.
[
https://doi.org/10.38195/judik.2018.02.19.1.21
]
김종성·강정은, 2018. “압축형 공간구조 특성이 도시 열환경에 미치는 영향”, 「한국도시설계학회지: 도시설계」, 19(1): 21-36. -
Kim, J.Y., 2020. “Tasks of Urban Planning in the Post-COVID-19 Era”, Urban Planners, 7(3): 11-15.
김진유, 2020. “포스트코로나시대 도시계획의 과제”, 「Urban planners」, 7(3): 11-15. -
Kim, L.Y. and Moon, T.H., 2010. “The Effect of Compact City’s Spatial Factors on Social Sustianability”, Housing Studies Review, 18(3): 51-72.
김리영·문태훈, 2010. “압축도시 특성요인의 사회적 지속가능성에 대한 영향분석”, 「주택연구」, 18(3): 51-72. -
Kim, S.N., Lee, K.H., and Ahn, K.H., 2009. “The Effects of Compact City Characteristics on Transportation Energy Consumption and Air Quality”, Journal of Korea Planning Association, 44(2): 231-246.
김승남·이경환·안건혁, 2009. “압축도시 공간구조 특성이 교통에너지 소비와 대기오염 농도에 미치는 영향”, 「국토계획」, 44(2): 231-246. -
Lee, G.J., Park, J.H., and Lim, E.S., 2021. “Measuring Land Use Compactness of Cities in Korea Using Building Registry Data”, The Korea Spatial Planning Review, 111: 3-23.
이경주·박진호·임은선, 2021. “건물 데이터를 이용한 국내 도시의 토지이용 압축도 측정에 관한 연구”, 「국토연구」, 111: 3-23. -
Lee, J.E. and Lee, K.H., 2023, “Analysis of the Impact of Regional Characteristics and Spatial Connectivity on the COVID-19 Infections: A Case Study of 246 Cities in Korea”, The Korea Spatial Planning Review, 116: 25-38.
이조은·이경환, 2023. “코로나19 감염에 영향을 미치는 지역 특성 및 공간적 연결성 분석: 전국 246개 시군구를 대상으로”, 「국토연구」, 116: 25-38. -
Lee, J.H., Park, J.H., and Lee, G.J., 2020. “Planning Policy Agenda for Responding to Infectious Deseases”, KRIHS Policy Brief, No. 801.
이진희·박정호·이경주, 2020. “감염병 대응을 위한 공간정책 과제”, 「국토정책 Brief」, No. 801. -
Lee, S.C., 2020. “Exploring Compatibility of Density and Safety: An Inquiry on Spatial Planning Shift in COVID-19 Era”, Journal of Korea Planning Association, 55(5): 134-150.
[
https://doi.org/10.17208/jkpa.2020.10.55.5.134
]
이시철, 2020. “밀도와 안전의 공존 가능성 : 코로나19 시대, 공간계획의 변화 방향 예측”, 「국토계획」, 55(5): 134-150. -
Lee, S.S., 2015. “Effects of Compact City Planning on the Regional Economic Development : The Case of Metropolis Cities in China”, Ph. D. Dissertation, Seoul National University.
이순성, 2015. “압축적 도시계획요소가 지역경제발전에 미치는 영향”, 서울대학교 대학원 박사학위논문. -
Lee, W.D. and Hwang, C.S., 2011. “A Measurement of Urban Compactness in Seoul Metropoliton Area”, The Geographical Journal of Korea, 45(1): 163-173.
이원도·황철수, 2011. “서울시 도시공간구조의 압축성 측정”, 「국토지리학회지」, 45(1): 163-173. -
Ministry of Health and Welfare, 2023. “COVID-19, Changes in Response to Infectious Diseases Over the Past 3 Years - Status of Response to Infectious Diseases after Transition to Scientific Quarantine System -”, January 20 Press Release.
보건복지부, 2023. “코로나-19, 지난 3년간 감염병 대응의 변화 –과학방역체계 전환 이후 감염병 대응 현황–”, 1월 20일 보도자료. -
Mo, B., Feng, K., Shen, Y., Tam, C., Li, D., Yin, Y., and Zhao, J., 2021. “Modeling Epidemic Spreading Through Public Transit Using Time-Varying Encounter Network”, Transportation Research Part C: Emerging Technologies, 122: p.102893.
[https://doi.org/10.1016/j.trc.2020.102893]
-
Moon, S.G., Kim, Y.K., Son, W.S., Kim, J.H., Choi, J., Na, B.J., Park, B., and Choi, B.Y., 2020. “Time-Variant Reproductive Number of COVID-19 in Seoul, Korea”, Epidemiology and Health, 42: e2020047.
[https://doi.org/10.4178/epih.e2020047]
-
Neuman, M., 2005. “The Compact City Fallacy”, Journal of Panning Education and Research, 25(1): 11-26.
[https://doi.org/10.1177/0739456X04270466]
-
Oh, J.H., 2022. “A Study on the Effects of Urban Density, Sociodemographic Vulnerability, and Medical Service on the Impact of COVID-19”, Master’s Degree Dissertation, Yonsei University.
오장현, 2022. “도시밀도, 사회인구적취약성 및 의료서비스가 코로나19 피해에 미치는 영향에 관한 연구.” 연세대학교 대학원 석사학위논문. -
Park, K.W., Choi, M.J., and Cho, H.S., 2017. “The Effects of Urban Compactness on Temperature”, Journal of Environmental Policy and Administration, 25(1): 1-19.
[
https://doi.org/10.15301/jepa.2017.25.1.1
]
박귀원·최막중·조희선, 2017. “압축도시특성이 기온에 미치는 영향”, 「환경정책」, 25(1): 1-19. -
Shin, H.C. and Woo, M.J., 2021. “The Impact of Compact City Indicators and Commuting Network on Commuting Time: Focused on Suburban Cities in the Seoul Metropolitan Area”, Journal of the Korean Regional Science Association, 37(2): 49-61.
신학철·우명제, 2021. “압축지표와 통근 네트워크가 통근시간에 미치는 영향에 관한 연구 –수도권 경기·인천 지역을 대상으로–”, 「지역연구」, 37(2): 49-61. -
Sim, B.R. and Park, M.B., 2021. “Factors Associated with COVID-19 at the community Level: Comparison with National Notifiable Infectious Diseases”, Journal of Regional Studies and Development, 30(2): 109-126.
심보람·박명배, 2021. “지역사회단위에서의 COVID-19 발생률의 결정 요인: 법정감염병 발생률과의 비교”, 「지역발전연구」, 30(2): 109-126. -
Song, K.W. and Nam, J., 2009. “An Analysis on the Effects of Compact City Characteristics on Transportation Energy Consumption”, Journal of Korea Planning Association, 44(5): 193-206.
송기욱·남진, 2009. “압축형 도시특성요소가 교통에너지 소비에 미치는 영향에 관한 실증분석”, 「국토계획」, 44(5): 193-206. -
Sung, H.G., 2020. “Urban Vulnerability of Infectious Diseases and Urban Planning”, Urban Planners, 7(3): 40-44.
성현곤, 2020. “감염병의 도시취약성과 도시계획”, 「Urban Planners」, 7(3): 40-44. -
Teller, J., 2021. “Urban Density and Covid-19: Towards an Adaptive Approach”, Buildings & Cities, 2(1): 150-165.
[https://doi.org/10.5334/bc.89]
-
Yang, S.C., Jang, J.H., Park, S.Y., Ahn, S.H., Kim, S.S., Park, S.B., Ryu, B.Y., Lee, S.Y., Shin, E.J., Kim, N.Y., Yoo, M.S., Lee, J.G., Kim, T.Y., Kang, A.R., and Kwon, D.H., 2022. “Two-Year Report of COVID-19 Outbreak from January 20, 2020 to January 19, 2022 in the Republic of Korea”, Public Health Weekly Report, 15(7): 414-426.
양성찬·장진화·박신영·안선희·김성순·박수빈·류보영·이선영·신은정·김나영·유명수·이종걸·김태영·강애리·권동혁, 2022. “국내 코로나19 확진자 2년 발생 보고서(2020.1. 20.∼2022.1. 19.)”, 「주간 건강과 질병」, 15(7): 414-426. -
Yoo, M.S., Kim, Y.J., Baek, S.J., and Kwon, D.H., 2021. “The Concept of Reproduction Number and Changes According to Government Response Policies”, Public Health Weekly Report, 14(6): 282-289.
유명수·김연주·백수진·권동혁, 2021. “감염재생산지수 개념 및 방역정책에 따른 변화”, 「주간 건강과 질병」, 14(6): 282-289.