Final publication date 16 Oct 2023
Compensating for Negative Economic Impacts of COVID-19 : Short-term Cash-Transfer Measures to Households and Firms in Seoul's Economy, South Korea

Abstract
This paper employs a Spatial Computable General Equilibrium model spanning 50 urban clusters to investigate the economic fallout of Seoul's social distancing policies, while identifying effective cash transfer strategies to cushion these impacts targeting different groups (households or firms) and types of subsidy distribution (loss-based or employment-based).The imposition of social distancing measures corresponded with a 6.48% decrease in Seoul's Gross Regional Product (GRP), a downturn that could be counteracted with targeted cash transfers to firms, on the basis of employee numbers or economic losses (around 6.42~6.43% of GRP). This approach is more beneficial than direct cash transfers to households (6.58% of GRP) as it allows for subsidies proportional to losses endured by regional firms. Yet, such measures may not fully alleviate the negative economic implications of Seoul's policies on the national economy (6.74% of GRP). Given that these economic costs are primarily incurred from production disturbances, it would be rational to implement short-term financial aid aimed at producers. However, due to difficulties in accurately estimating these losses, an employment-focused strategy emerges as a more practical policy solution.
Keywords:
COVID-19, Spatial CGE Model, Cash Transfer, Social Distancing, Economic Resilience키워드:
코로나19, 공간연산일반균형모형, 긴급재난지원금, 사회적 거리, 경제 회복력Ⅰ. Introduction
Policies advocating physical distancing have emerged globally as pivotal strategies for inhibiting the propagation of infectious diseases, notably COVID-19. These tactics include strict regulations regarding spatial separation (e.g., maintaining a two-meter distance), and curtailing direct human interactions, thus effectively forestalling mass congregations. Remote working arrangements such as work from home have also been implemented to alleviate the risk of potential viral exposure. Such protocols are continuously refined, mirroring the varying incidence of COVID-19 diagnoses and the capability of healthcare infrastructures to manage critical cases. In 2020, the government of Seoul enacted an assortment of distancing and preventive measures, executing fifteen such interventions over a period of 182 days. The actions varied widely, including limitations on occupancy based on location factors, reductions in business hours (including public transportation), and broad-scale limitations on commercial and societal activities (Ju et al., 2021). The implementation of these measures, driven by individual apprehensions regarding viral transmission, resulted in diminished commuter transit and overall mobility, leading to an inevitable decrease in economic activities. This includes temporary closures of small to medium enterprises, disruption of supply chains, and reductions in productive capacities and consumer purchasing power. Ju et al. (2021) argued that 2020 saw a 7.6% decrease in population mobility compared to the preceding year, with an associated reduction in retail sales by 6.2%. Industries requiring close physical interaction, such as hospitality, restaurants, apparel retailers, educational institutions, and retail outlets were disproportionately affected. In contrast, industries like automobile sales, e-commerce, and home entertainment noted an unexpected increase in sales due to an increased dependency on digital platforms despite the prevailing economic downturn. Kim et al. (2022) discovered that a 10% decrease in spatial interaction due to social distancing policies corresponded to a reduction in the national Gross Domestic Product (GDP) between 0.82% and 0.86%. This economic downturn was broken down into a 0.73% loss due to reduced agglomeration effects, a 0.08% to 0.13% loss due to health effects, and a 0.01% loss due to labor effects. In an attempt to mitigate the deleterious impact of COVID-19 and its associated social distancing policies on economic agents, both national and Seoul governments initiated cash-based transfers to households, equivalent to 30.3% of the median income for a family of four, in March 2020. This first income subsidy was equivalent to 14.4% of total revenues of small business owners during three months from May, which could compensate for their financial losses (Cho et al., 2022).
This study aims to address two primary research questions: how does the reduction in the population mobility due to social distancing impact urban economic growth in Seoul and its adjacent cities and counties, and which is effective for economic recovery of Seoul between support measures for firms as producers and for households as consumers? This paper examines potential countermeasures to offset economic losses due to social distancing, focusing on the linkage between the spatial interactions and economic activities in a production and consumption framework. A Spatial Computable General Equilibrium (SCGE) model has been developed for 50 urban clusters in South Korea to gauge the dynamic effects of spatial interactions on Seoul’s urban economy, and to evaluate the influence of policy tools on the economic costs incurred by social distancing. The model integrates agglomeration economies with regional productivities under a spatial price equilibrium structure. The SCGE model has been designed to capture the spatial economic impacts of urban and regional policies, as well as unexpected events on resource allocation across different regions. The paper is structured as follows: Section 2 details the application of the CGE model to COVID-19 issues, and outlines the development of the SCGE model for 50 urban clusters in South Korea. Section 3 calibrates economic damage resulting from population mobility regulations, and identifies how the loss could be compensated with. In the final section, we discuss potential applications of these findings in devising spatial policy responses to societal disasters, and propose directions for future research.
Ⅱ. Development of SCGE Model for 50 Urban Clusters of South Korea
The CGE model has been developed for finding an optimal combination of prices and quantities for multiple sectors under constraints, and is composed of a simultaneous system comprising identity and behavioral equations to focus on the economic interactions between regional supply and demand within a production-consumption structure. Given the model’s performance to estimate both the direct and indirect effects of public policies and unexpected events on the economy, it has also quantified the negative and positive impacts of the COVID-19 pandemic and various social distancing measures on economic agent behavior and industrial activities. Maliszewska et al. (2020) applied a standard global CGE model to forecast the potential influence of lockdown measures on global GDP. Their findings suggested that short-term lockdowns could lead to a GDP contraction of 2.5%, a figure that could inflate to 4% in the case of long-term lockdowns. Porsse et al. (2020) employed a dynamic interregional CGE model to scrutinize the economic fallout of COVID-19 on the Brazilian economy. Their analysis indicated that due to reduced labor supply and temporary shutdowns, the GDP growth rate might undergo a decline ranging from 0.48% to 3.78%. Malahayati et al. (2021) projected an impending economic stagnation by 2021, with GDP levels predicted to be 4-8% lower than those observed under business-as-usual scenarios. Despite an anticipated decrease of 30% to 50% in the value-added of transportation and tourism sectors, the research suggested that the agricultural sector could provide employment for those displaced from their jobs. Shifting the model’s application to the transport sector, Cui et al. (2021) discovered a significant decrease in outputs across passenger transport sectors (3.08-11.44%) and freight transport sectors (1.03-2.85%). Their research highlighted the vulnerability of certain transportation sectors, including railways, waterways, and aviation, to the pandemic-induced supply-side shocks, whereas road and pipeline transportation sectors were affected by demand-side shocks. Moving to the comparison of policy effectiveness, Lui et al. (2021) embarked on an assessment of the efficacy of monetary and fiscal policy countermeasures in mitigating economic damage to GDP and employment. Despite the noted success of these countermeasures, this paper recorded adverse side-effects, such as an increase in consumer prices by 1.05% and 0.57% respectively. While fiscal policies had a predominantly positive impact on almost all producing sectors, monetary policies exerted a negative influence on export-oriented manufacturing sectors.
Such comprehensive investigations offer invaluable insights into the potential implications of the pandemic on the behaviors of economic agents at both the national and industrial levels. Nonetheless, there is a notable paucity of research focusing on spatial economic impacts, despite the inherently spatial nature of social distancing measures and their effects on population mobility and COVID-19 transmission patterns. Recognizing this research gap, we developed a SCGE model aimed at delineating the direct and indirect consequences of COVID-19’s dissemination on economic behaviors at the urban and regional scales. This allows for the subsequent assessment of various policy measures’ efficiency and effectiveness. The SCGE model in this paper, distinguished from conventional CGE models, centers on the economic activities of small and medium-sized spatial units such as cities and counties. Rooted in the principles of urban microeconomic theory, the model’s specifications, the interrelationships among regional and sectoral markets, and the treatment of time-effects have been modified according to spatial growth and development theories, simulation types, and data accessibility. The SCGE model incorporated in this paper reflects the principles of new economic geography and endogenous growth theories, based on Ando and Meng (2009, 2014), Kim and Hewings (2009), Kim et al. (2004), and Kim et al. (2014). This integration serves to underscore (1) the significance of spatial accessibility (or transportation costs) in influencing the mobility of households and firm relocations, (2) variations in regional productivities engendered by the agglomeration economy, (3) long-distance economies spurred by reductions in travel times and tariffs, and (4) regional consumer preferences for a diversity of goods. While each economic agent such as producer (firm) and consumer (household) optimizes its economic goal through profit maximization or utility maximization under constraints, the quantity is determined by the behavioral optimization of each economic agent. Commodity prices are endogenously identified to equilibrate the demand and supply of each input factor and commodity market. As depicted in <Figure 1>, the SCGE model represents a multiregional economic-wide analytical tool, aggregating all 229 cities and counties of South Korea into 50 clusters. This includes five urban clusters in Seoul (central, southeast, southwest, northeast, and northwest) based on the 25 “Gu” districts (a local administrative unit of a city in South Korea). The urban cluster formulation relies on data from the Korea Research Institute for Human Settlements (2020), Korea Labor Institute (2020), and sub-regions classified in spatial development planning at the province (state)-scale level. Each cluster consists of two types of economic agents–producers (firms) and consumers (households)– and is composed of two modules: (1) production and trade, and (2) consumption and (dis) equilibrium on the real-side economy.

Regional classification for SCGE model
The production and trade module posits each firm within an urban cluster as the producer of a singular representative commodity, optimized for profit through a three-tier Cobb–Douglas production function as detailed in <Figure 2>. The top-tier output is formulated through Cobb–Douglas production technology, aligning the value-added and intermediate inputs aggregates. The firm then adjusts its quantities within fixed output shares and a dual weighted average price framework. At the second-tier level, the value-added production is calculated through a Translog production function that integrates two primary inputs, labor (employment) and capital stock variables, with two external variables– population density and spatial interactions (accessibility). This functional form is built on the presumption of additivity (constant returns to scale) and symmetry between factor input variables, facilitating the interaction term between any pair among the four independent variables. This functional setup indicates that the elasticity of each variable with respect to the value added can be specified as a linear function of all the variables. Regarding intermediate input, it employs the Cobb-Douglas production function, which holds an elasticity of substitution of one. This input depends on several factors including the input coefficient, regional output, destination’s production price, and the origin’s price. If the quality of the commodities from competing firms is homogeneous, firms are likely to purchase more commodities from the lowest bidder. The demands for factor inputs emanate from the firm’s objective to maximize its value-added, a process where the marginal revenue of each factor input is matched with its input price. Each region’s factor prices, such as wages, comprise a temporally constant regional-specific distortion term and a national average rate that ensures equilibrium in the supply and demand for each factor input market. Under the Neoclassical labor market closure rule, it is presumed that full employment is achieved. On the other hand, the wage rate is treated as exogenous, or unemployment might occur in accordance with the Keynesian labor market closure rule.

Production structure
On the third-tier level, the value added function incorporates a spatial interaction variable, measured as a weighted average of road and railroad accessibility values across 229 cities and counties. Each origin region’s accessibility is calculated by aggregating the population sizes of the destination regions and dividing by the minimum travel time between the origin and all destinations which network analysis on the road and railroad maps provides. This accessibility serves as a surrogate for spatial interactions, exerting either positive or negative effects on value-added through shifts in the production function parameter. Labor mobility is determined by multiregional migration, which is calculated using a Todaro-type function that takes into account the relative economic and social attractiveness of the destination over the origin. The current period’s population is calculated as the sum of the natural growth of the population size from the previous period and the net in-migrants, responding to interregional differentials from the origin to the destination concerning per capita income, employment opportunities, population density, and the physical distance between urban clusters, as delineated in Todaro (1994).
In the consumption and (dis)equilibrium module, regional income is generated from wages and capital returns as part of the value added. Concurrently, the regional household, by optimizing a Cobb-Douglas type utility function, can identify optimal combinations of consumption goods contingent on the price and the income. In this study, we distinguish price variables into Free On Board (FOB) prices linked with the supply side and Cost, Insurance, and Freight (CIF) prices related to the demand side. FOB prices are defined as the costs at which firms produce their goods, constituting the summation of the value-added price and the marginal costs of intermediate inputs. CIF prices represent the market prices paid by consumers for commodities and services and encompass the production cost (FOB price) at the origin (production area) and the transportation cost, which is calculated by multiplying travel time (distance) by the tariff rate. The FOB price and national-level factor input prices are determined by reaching a balance of demand in each market under the Walrasian equilibrium condition.
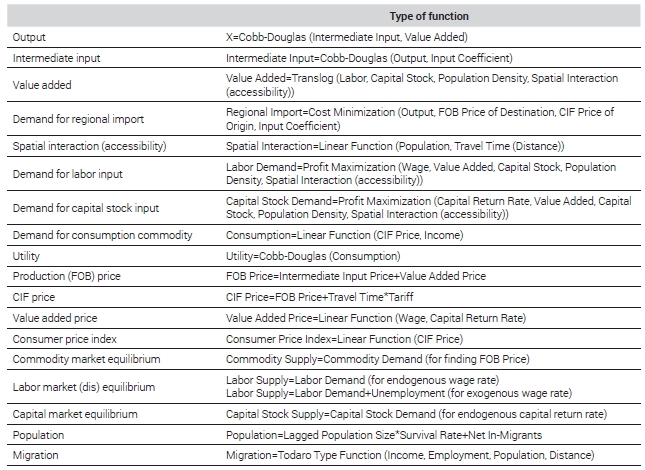
To construct the SCGE model, a benchmark data set such as a multiregional IO or Social Accounting Matrix is required. This ensures internal consistency regarding financial and commodity flows among regional economic agents, i.e., firms and households, considering their respective incomes and expenditures. Furthermore, it provides initial values and structural coefficients (non-elasticity parameters including input coefficients and consumption propensities) for the SCGE model. An extended multiregional IO table at the city and county level (lower-level local administrative unit) from 2019 serves as a reference for the model, calibrated based on the Multiregional IO table at the province level (upper-level local administrative unit) of 2015, and the National IO table of 2019. Two types of parameters are integrated into the SCGE model: structural and behavioral parameters. Behavioral equations such as the value-added production function are estimated using the SUR regression model with 2019 cross-sectional data. Shift and share parameters in the SCGE model are adjusted to reproduce the extended IO model at the base run. The SCGE model consists of 13,055 behavioral and identity equations and endogenous variables, which can capture a unique solution of the variables under convexity. Exogenous variables encompass a travel-time matrix and the lagged population size, while the consumer price index or the wage is treated as the numeraire for the model, depending on the selection of the labor market closure rule. The SCGE model’s validity can be examined through a robustness (sensitivity) analysis on key parameter values. For instance, a 5% increase in the elasticity of spatial accessibility for the value-added would elevate the GDP by 0.31–0.49%, thereby demonstrating that the model is apt for counterfactual analysis. The numerical specifications of the model are presented schematically in <Table 1>.

Specification of SCGE model
Ⅲ. Counterfactual Analysis: Evaluating Short-term Cash-Transfer Measures in Seoul’s Economy
The imposition of social distancing policies exhibits both short-run and long-run impacts on the economy. The former encompass the contraction of national and regional outputs, sales declines in industries reliant on face-to-face interactions, disturbances in logistic networks and global supply chains, and temporary closure of small and medium-sized enterprises. An increase in unemployment rates is observed alongside a transition towards remote work arrangements. Over the long-term, potential effects may manifest as diversification within outsourcing and production chains, incremental increases in tax rates to manage budget deficits, widespread adoption of digital technologies and e-commerce, adaptations of work environments suitable for remote operations, and the expansion of industries that can function with minimal physical contact. As these impacts as strong territorial dimension tend to permeate into neighboring areas, the application of the SCGE model to evaluation of COVID-19 policies is particularly apt due to its capacity to account for interactions among small and medium-sized spatial units.
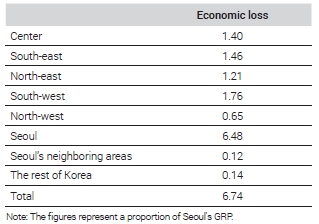
<Table 2> summarizes the effects of social distancing policies on Seoul’s and the national economy, quantified as deviations from the baseline scenario, while the spatial effects on the economic growth of urban clusters are showed in <Figure 3>. We estimated the social distancing shock values using the population mobility data from the Seoul Open Data of Seoul Government (2021). The year 2020 experienced a decrease in trip frequency in comparison to the previous year, with reductions amounting to 6.64% in the central area, 5.25% in the southeast, 10.05% in the northeast, 9.06% in the southwest, and 8.31% in the northwest of Seoul. From the simulation, the enactment of social distancing measures in Seoul in 2020, incorporating limitations on business operations and economic activities, would results in a 6.74% of Seoul’s Gross Regional Product (GRP) equivalent to $ 25.39 billion (KRW 29.96 trillion) across all regions. While the economic loss for Seoul’s economy totals 6.48% of its GRP ($ 24.41 billion, KRW 28.81 trillion), the highest cost was incurred by the south-west region (1.76% of the GRP), succeeded by the south-east (1.46%), center (1.40%), northeast (1.21%), and north-west (0.65%). The two most adversely affected regions exhibit a high population density, a significant young demographic, and a specialization in service-oriented sectors. These findings are linked to the distinct consumption patterns of households in Seoul, such as tourism demand, directly shaped by social distancing policies.
Economic loss from social distancing policies of Seoul(unit: %)

Spatial impacts of Social distancing on regional economic growthNote: This is intended to emphasize regions with notably high relative impact, rather than delineating the explicit intensity of individual areas. Namely, more intense coloration indicates a more substantial adverse impact.
This paper explores the question of how to compensate for the economic losses resulting from the spatial mobility restrictions imposed by social distancing policies. As per the classifications by Kim et al. (2022) and the World Bank (2022), the emergency economic support policies instated by South Korea in response to the COVID-19 pandemic can be divided into six primary sectors: (1) the provision of direct stimulus grants to individuals, (2) initiatives for job creation and unemployment benefits, (3) financial assistance, (4) support extended to specific industries, for instance, the tourism and transportation sectors, (5) public welfare, and (6) specially-designated funds assigned for disaster-afflicted areas. For the purpose of this study, these are consolidated into two main support measures directed at households and firms in terms of the government’s initiatives for loss offsetting (OECD, 2020). The fiscal and financial strategies planned for households are primarily designed with the objective of improving cash flow. These largely consist of direct cash-based transfers and tax measures, such as deferred tax payments and accommodating arrangements for tax debt repayments. On the other hand, the measures geared towards firms incorporate cash-based transfers as well as labor market and social insurance schemes like paid leave or unemployment, social security contributions, wage subsidies, and subsidies for reduced work time (World Bank, 2022).
We establish two alternatives for cash transfers: (1) for households as a policy of demand, and (2) for firms as a policy of supply, with the aim of counteracting the economic losses sustained by Seoul’s economy due to the implementation of social distancing measures. The World Bank (2022) disclosed that cash transfer programs emerged as the most predominant social assistance intervention amidst the COVID-19 pandemic in 2022. While there were 3,856 social protection and labor measures toward economic recovery in the world, the cash transfer programs accounted for 962 of these measures, implemented in 203 countries. The disbursement of cash transfers in South Korea is subject to the number of household members and their residential locations. For instance, in Seoul, a four-member household could be eligible for up to $ 1,220 (KRW 1.440 million). Economically vulnerable groups in critical need, including recipients of livelihood assistance, basic pensions, and disability pensions, are prioritized for cash assistance. Other beneficiaries have the option to receive aid through credit or check cards, prepaid cards, or local love vouchers, usable only within the cities of their registered address. This approach closely parallels the Economic Impact Payments executed under the American Rescue Plan Act of 2021. Under this U.S. plan, eligible individuals could receive up to $ 1,400, while married couples filing jointly could receive up to $ 2,800, in addition to $ 1,400 for each qualifying dependent, encompassing adult dependents.
These strategies are expected to have immediate effects on financially vulnerable households and firms in the midst of the crisis, directly providing the affected demographic with cash subsidies. In this paper, we assume that the distribution of cash transfer expenditure across various urban clusters in Seoul is contingent upon the estimated economic loss discussed in <Table 2> and the size of the population or employment corresponding to households or firms. Specifically, the alternative targeting firms is further classified into two sub-categories for allocating government funds to five urban clusters: loss-based or universal-based (employment-based). Although theoretically appearing optimal, the loss-based approach—which allocates subsidies in proportion to regional losses—faces significant challenges in practical implementation. This is owing to the difficulties in accurately determining the extent of losses each entity has endured. Conversely, the universal-based approach, wherein the allocation of subsidies is standardized per employee (employment-based for firms) or per capita (population-based for households) and, presents a more feasible alternative given its simpler and more straightforward applicability.
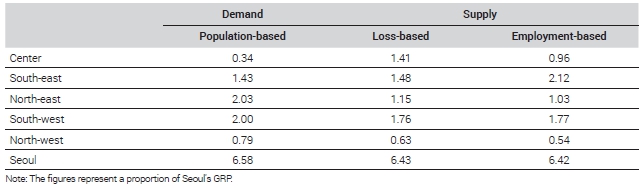
<Table 3> shows how the economic loss (6.48% of Seoul’s GRP) could conceivably be counterbalanced by the provision of cash transfers. These transfers, targeting households, could require 6.58% (when population-based) of the GRP ($ 24.79 billion, KRW 29.25 trillion), or, when directed towards firms, range between 6.42% (when labor-based) equivalent to $ 24.19 billion (KRW 28.54 trillion) and 6.43% (when loss-based) equivalent to $ 24.22 billion (KRW 28.58 trillion). These findings imply that the primary strategy for Seoul’s economy should be to enhance cash flows for firms based on employment or economic losses. Implementing cash transfers to firms as a supply channel would potentially facilitate more efficient utilization of governmental fiscal resources.
Cash-transfer expenditures to households and firms in Seoul(unit: %)
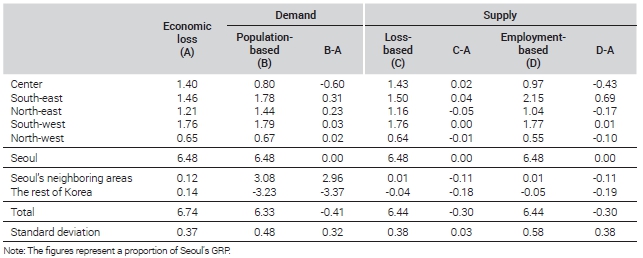
<Table 4> presents a summary of the spatially differentiated impacts of four short-term alternative strategies for Seoul’s economic recovery from damages of the social distancing. In the simulation, we initially assume that Seoul households can buy goods from Seoul as well as other Korean regions. However, using the private consumption parameters, this can be adjusted to restrict purchases to only Seoul products. Despite the apparent uniformity in the overall impact of these strategies on the Seoul economy, they yield considerably varying spatial outcomes. Implementation of social distancing policies in Seoul has resulted in an estimated 6.74% decrease in South Korea’s GRP, with only 0.12% and 0.14% impacts on areas in close proximity to Seoul and the rest of Korea, respectively. Should income subsidies be directed towards Seoul households, total national value added of South Korea would increase by 6.33% of Seoul’s GRP. This falls short of the overall economic loss of 6.74% of Seoul’s GRP. Although such a measure would positively influence the economies of areas adjacent to Seoul, it may concurrently pose adverse effects on the rest of Korea’s economy. Conversely, cash transfers made to firms would result in a 6.44% impact on the national economy, still insufficient for comprehensive economic recovery, but significantly alleviating the negative impact on the economy of the rest of Korea. If these business subsidies are determined based on economic losses, they could nearly counterbalance the losses across all five regions of Seoul. The minimum standard deviation between the economic outcomes of cash transfer policies and the economic losses due to social distancing is found in the case of loss-based cash transfers to firms (0.03). This implies that this approach may be the most effective tool for the economic recovery of Seoul: for cost-saving of government expenditures, cash transfer amounts should be computed based on economic losses, with income subsidies targeting businesses to compensate for regional losses in a balanced manner. Nonetheless, in the midst of a crisis, discerning the most adversely affected sectors and quantifying their respective financial losses can pose significant challenges in the absence of a comprehensive financial information system. The implications derived from these results accentuate the necessity for government authorities to underscore regionally adapted strategies in the execution of COVID-19 recovery, adaptation, and response measures. This should encompass the establishment of locally tailored social distancing protocols and quarantine guidelines.
Cash-transfer effects on Seoul and National Economic Growth(unit: %)
Ⅳ. Conclusion
This paper develops the SCGE model across 50 urban clusters to explore the economic consequences of social distancing policies in Seoul and to distinguish the most advantageous cash transfer strategies for mitigating these adverse effects, targeting different groups (households or firms) and types of subsidy distribution (loss-based or employment-based). The imposition of social distancing measures has led to a contraction of 6.48% in Seoul’s GRP, a decline that could be effectively mitigated by directing cash transfers towards firms, contingent on their employee count or the magnitude of economic losses (approximating 6.42~6.43% of GRP). This strategy demonstrates a distinct advantage over cash transfers made directly to households (accounting for 6.58% of GRP), as this subsidy can be allocated in proportion to losses suffered by regional businesses. However, this level of financial support may fall short in offsetting the adverse economic repercussions of Seoul’s policy on the national economy (accounting for 6.74% of GRP). Since these economic burdens are primarily a result of disruptions to production activities, it would be reasonable to implement the short-term financial aid directed towards producers. Nevertheless, the complexity in accurately assessing the extent of these losses leads to the employment-based strategy as a more realistic policy alternative.
Potential future research directions include reevaluating the criteria for assigning income subsidies in a universal-based approach, a system currently predicated on family size. The support system may be refined, incorporating factors such as income level, employment status, family configuration, regional characteristics, and social contributions. Another subject is to examine how regional industrial and locational policies in the changing landscape post-COVID-19 are reconfigured in responses to the disruptions to the global production network and shifts towards remote work and networked, e-commerce economies during the COVID-19 era. This includes investigating the economic consequences of reshoring strategies on urban and regional economic growth within the Seoul Metropolitan Area, and their subsequent impact on long-term spatial configurations. Simultaneously, additional key area of research issue is to assess the influence of remote working arrangements on commercial and residential land uses, and forecasting transformations within real estate markets over a mid-to-long-term horizon. Finally, as previously outlined, the model operates under the assumption of a single representative producer in each region, a necessary simplification to avoid computational complexities. This assumption, however, limits the model’s capacity to discern varied economic effects across different industrial sectors. It would be crucial to disaggregate the industrial sectors into more specific categories. At the least, a distinction between service-based sectors, such as retail and wholesale businesses necessitating personal interactions, and commodity-based sectors is vital. This enhanced classification is expected to improve the accuracy of estimating the negative impacts of social distancing policies on various industrial activities.
Acknowledgments
This work was supported by the Ministry of Education of the Republic of Korea and the National Research Foundation of Korea (NRF-2021S1A3A2A01087370) and the Teajae Research Foundation under the project of “A Study on the Alternative Compact and Competitive City”.
References
-
Ando, A. and Meng, B., 2009. “The Transport Sector and Regional Price Differentials: A Spatial CGE Model for Chinese Provinces,” Economic Systems Research, 21(2): 89-113.
[https://doi.org/10.1080/09535310903009627]

- Ando, A. and Meng, B., 2014. Spatial Price Equilibrium and the Transport Sector: A Trade-consistent SCGE Model, IDE Discussion Paper No. 447, Institute of Developing Economies.
- Cho, D.H., Kang, M.S., and Yoon, J.J., 2022. The Impact of COVID-19 on Self-Employment in Seoul and the Effect of Universal Disaster Support Funds, The Seoul Institute. (in Korean)
-
Cui, Q., He, L., Liu, Y., Zheng, Y., Wei, W., Yang, B., and Zhou, M., 2021. “Measuring the Impacts of the COVID-19 Pandemic on China’s Transport Sectors Based on the CGE Model Coupled with a Decomposition Analysis Approach,” Transport Policy, 103: 103-115.
[https://doi.org/10.1016/j.tranpol.2021.01.017]
- Ju, J.U., Rho, S.C., and Yoon, J.J., 2021. Effects of Spreading of COVID 19 on Seoul Economy, The Seoul Institute. (in Korean)
-
Kim, E.J. and Hewings, G.J.D., 2009. “An Application of Integrated Transport Network –Multiregional CGE Model to Calibration of Synergy Effects of Highway Investments,” Economic Systems Research, 21(4): 377-397.
[https://doi.org/10.1080/09535310903444758]
-
Kim, E.J., Hewings, G.J.D., and Hong, C.W., 2004. “An Application of Integrated Transport Network Multiregional CGE Model I: A Framework for Economic Analysis of Highway Project,” Economic System Research, 16(3): 235-258.
[https://doi.org/10.1080/0953531042000239356]
-
Kim, E.J., Hewings, G.J.D., and Nam, K.M., 2014. “Optimal Urban Population Size: National vs Local Economic Efficiency,” Urban Studies, 51(2): 428-445.
[https://doi.org/10.1177/0042098013489737]
-
Kim, E.J., Jin, D.Y., Lee, H.J., and Jiang, M., 2022. “The Economic Damage of COVID-19 on Regional Economies: An Application of a Spatial Computable General Equilibrium Model to South Korea,” The Annals of Reginal Science, 71: 243-268.
[https://doi.org/10.1007/s00168-022-01160-8]
- Korea Labor Institute, 2020. Korean Local Labor Market 2015. (in Korean)
- Korea Research Institute for Human Settlements, 2020. Spatial Mismatch in Local Labor Market and Policy Directives. (in Korean)
-
Liu, Y., Cui, Q., Liu, Y., Zhang, J., Zhou, M., Ali, T., Yang, L., Feng, K., Hubacek, K., and Li, X., 2021. “Countermeasures against Economic Crisis from COVID-19 Pandemic in China: An Analysis of Effectiveness and Trade-Offs,” Structural Change and Economic Dynamics, 59: 482-495.
[https://doi.org/10.1016/j.strueco.2021.09.017]
-
Malahayati, M., Masui, T., and Anggraeni, L., 2021. “An Assessment of the Short-Term Impact of COVID-19 on Economics and the Environment: A Case Study of Indonesia,” EconomiA, 22(3): 291-313.
[https://doi.org/10.1016/j.econ.2021.12.003]
-
Maliszewska, M., Mattoo, A., and van Der Mensbrugghe, D., 2020. The Potential Impact of COVID-19 on GDP and Trade: A Preliminary Assessment, World Bank Policy Research Working Paper, 9211.
[https://doi.org/10.1596/1813-9450-9211]
-
Porsse, A.A., de Souza, K.B., Carvalho, T.S., and Vale, V.A., 2020. “The Economic Impacts of COVID‐19 in Brazil Based on an Interregional CGE Approach,” Regional Science Policy & Practice, 12(6): 1105-1121.
[https://doi.org/10.1111/rsp3.12354]
- Todaro, M.P., 1994. Economic Development, New York: Longman.
- OECD, 2020, May 19. “Tax and Fiscal Policy in Response to the Coronavirus Crisis: Strengthening Confidence and Resilience,” https://www.oecd.org/coronavirus/policy-responses/tax-and-fiscal-policy-in-response-to-the-coronavirus-crisis-strengthening-confidence-and-resilience-60f640a8/
- Seoul Government, 2021. “Seoul Survey on Urban Indications,” Accessed May 20, 2023. https://data.seoul.go.kr/dataList/OA-15564/F/1/datasetView.do
- World Bank, 2022, February 2. “Social Protection and Jobs Responses to COVID-19: A Real-Time Review of Country Measures,” https://policycommons.net/artifacts/2232431/social-protection-and-jobs-responses-to-covid-19/2990020/