Final publication date 13 Sep 2023
Rethinking Post-pandemic Urban Planning Strategies: Lessons from Singapore and Hong Kong
 ; Lee, So Young**
; Nam, Kyung-Min***
; Lee, Kwan Ok****
; Lee, So Young**
; Nam, Kyung-Min***
; Lee, Kwan Ok****
Abstract
We examine urban planning strategies at multiple scales that Singapore and Hong Kong have reinforced or accelerated as a response to the COVID-19 pandemic. The pandemic tended to further strengthen the rationale for preexisting strategies, such as sustainability-oriented planning in Singapore and compact-city-development initiatives in Hong Kong, rather than demanding their drastic change. Crucial components of their strategic planning toward a green and resilient high-density urban development model include polycentric urban structure, self-contained neighborhoods, three-dimensional mixed land use, accessibility to green/open spaces, and pedestrian-friendly urban environments. Planning regulations and urban design standards form a primary implementation mechanism, and well-aligned policy incentives and public-private partnerships complement them. The efforts Singapore and Hong Kong have made toward a sustainable and compact city offer a useful benchmark case for other cities exploring post-pandemic planning directions.
Keywords:
Post-Pandemic Planning, Sustainability, Compact City, Singapore, Hong KongⅠ. Introduction
The Coronavirus Disease 2019 (COVID-19) pandemic and its reactionary policies and voluntarily precautious responses have changed many aspects of people’s lives, including work and education modes, mobility, social and leisure activities (Bereitschaft and Scheller, 2020; Lee and Lee, 2022; Shamshiripour et al., 2020). Public interventions, such as social distancing regulations, work-from-home schemes, and lockdown measures, reduced travel demand and changed travel purpose, distance, and modes, although the impact may vary by employment sector, neighborhood location, and individual/household socioeconomic status (Eom et al., 2022; Hamidi and Zandiatashbar, 2021; Molloy et al., 2021; Trasberg and Cheshire, 2021). On May 5, 2023, the World Health Organization officially declared the end of the pandemic, and the global community has since moved towards a new normal of living with COVID-19. However, this declaration does not necessarily mean that the disease is no longer a threat to public health. There is still a possibility that its variants or other infectious diseases may cause another pandemic in the future. Therefore, it is timely to discuss the direction of our post-pandemic planning strategies in creating more resilient urban environment.
Against this backdrop, we conduct a comparative case study of Singapore and Hong Kong. The primary motivation for delving into these two cases is that both cities feature such highly dense environment but also managed the COVID-19 pandemic relatively well, even though this environment could make them vulnerable to infectious diseases (Yuen et al., 2021). While Singapore and Hong Kong share many similarities in physical and socioeconomic environments such as their autonomous and global city status, their experiences amid the pandemic were not completely identical. For example, housing prices substantially increased in Singapore during the pandemic, while they moderately dropped in Hong Kong. Similarly, the negative shock on transit ridership was greater in Singapore than in Hong Kong. Also, urban planning strategies that two cities have developed to manage high-density urban environments present both similarities and disparities. Therefore, we believe that reviewing Singapore and Hong Kong from the comparative perspective will provide useful implications for similar, high-density cities around the world that aim to strengthen their resilience to the future pandemics.
Our study begins with the major impacts of the pandemic on local property market conditions and public mobility patterns in two cities. Travel modes and frequency that people choose for their commuting within the city are one of the most important factors to be considered for urban planning. Likewise, demand and supply for housing and commercial properties have a substantial impact on spatial restructuring of the city. The COVID-19 pandemic, with a series of voluntary and mandatory precautionary measures, has brought significant behavioral changes for working, consuming, and travelling, and in turn, led to changes in property markets and public mobility.
Then, we turn our attention to planning strategies that Singapore and Hong Kong have developed when these cities faced increased need to strengthen urban resilience to prepare for the potential future pandemics. As will be discussed, the pandemic did not necessarily cause a drastic change in planning paradigms or strategies in both cities; instead, it tended to further strengthen the rationale for preexisting strategies such as sustainability-oriented planning in Singapore and compact-city-development initiatives in Hong Kong, rather than demanding their drastic change. A similar trend is also found in Paris, Busan, Melbourne, and many other cities, which have placed the “15-minute City” concept at the center of their recent strategic plans (Kissfazekas, 2022). In this context, our case study introduces urban planning strategies of Singapore and Hong Kong at multiple scales. Facing serious natural resource constraints, both cities have developed effective spatial planning and management systems optimized to govern high-density urban environments (Kim et al., 2022). A close investigation of their planning strategies embracing components of sustainability and compact city development will convey crucial implications for other cities in formulating post-pandemic planning responses.
This paper consists of five sections in total. In Section 2, following this introduction section, we discuss the pandemic-introduced shocks on local property markets and urban mobility patterns in Singapore and Hong Kong. Then, the following two sections introduce both cities’ efforts to create a green and resilient high-density urban environment: Section 3 focuses on polycentric regional planning, mixed land use, hierarchical green planning, and self-sufficient residential town planning in Singapore, while Section 4 examines Hong Kong’s three-dimensional compact-city development strategies at region, district, and building levels. Finally, Section 5 concludes this study with key findings and implications.
Ⅱ. Urban Environment in Singapore and Hong Kong during the COVID-19 Pandemic
1. Singapore
The COVID-19 pandemic and its policy responses have influenced the housing market globally regarding housing supply and demand, housing sale and rental prices, and housing preference (Balemi et al., 2021; Bereitschaft and Scheller, 2020; Lee and Lee, 2023). Several papers describe a temporal but significant decrease in real estate market transaction volume with a plunge on the supply side with the uncertainly of the market and reduce in housing listings due to a lockdown or social distancing policy measures (Balemi et al., 2021; D’Lima et al., 2022). Yörük (2020) explains that the housing market in certain cities in the United States (US) experienced about a 60% decrease in new home listings and delayed home sales after two months of the COVID-19 occurrence compared to the previous year. However, as people adjusted to a stay-at-home lifestyle to reduce the chances of contracting the virus, their value of housing increased, while the housing supply has not fully recovered, which led to the housing price increase. The US housing market showed only a temporary slowdown during the lockdown period, then the median growth rate of the median housing price recovered and even exceeded the growth rate before the pandemic, with lower mortgage interest rates (Zhao, 2020).
The direct impact on the office and retail real estate market was more significant and continual than the residential market (Balemi et al., 2021). With the ease of the strict epidemic policies, the demand for housing had recovered quickly; however, the impact on the office real estate market was more significant as the continuous shift to remote work mode, which led to more interest in co-working spaces or shared office spaces (Balemi et al., 2021). In terms of the retail real estate market, the change from face-to-face to online commercial activities reduced the importance of locating a store on the ground floor, which mostly require high rent, and increased the demands of logistics facilities.
Moreover, household housing preference has changed with the continuous risk of contagious disease and the consequent changes, such as the work-from-home scheme and reduction in travel demand. The benefit of the high cost of living in central areas has been reduced as flexible working conditions continue, which is likely to lead to higher interest in residing in suburban areas or relatively smaller cities to reduce housing costs or enjoy spacious housing space (Balemi et al., 2021). The empirical study for the US housing market describes a reduced demand for neighborhoods with high population density and large cities after the COVID-19 pandemic (Liu and Su, 2021). This shift is driven by the flexibility of work location and the declining value of access to consumption amenities. Furthermore, the desire to have better accessibility to green spaces and bike routes has become evident to enjoy outdoor activities, as well as increasing demand for private outdoor living spaces such as balconies or terraces (Bereitschaft and Scheller, 2020). Lastly, Lee and Lee (2023) reveal that there was increasing demand for housing units on a higher floor or with more rooms while relatively decreasing demand for proximity to public transport and the Central Business District (CBD) after the pandemic.
Similar to the global world, the Singapore housing market has also been affected by the COVID-19 occurrence. According to the data from Urban Redevelopment Authority (URA), the number of transactions of private residential properties sharply decreased in the first and second quarters of 2020, resulting from the lockdown and social distancing policy measures. However, it bounced back swiftly in mid-2020, continuously increasing till the third quarter of 2021 (Figure 1). Notwithstanding, the transaction data of the private housing sector shows the heterogeneity in terms of location (i.e., the core of the central region, rest of the central region, outside of the central region); the number of housing sales located at the core of central region has dwindled, while ones for outside of the central region has risen. This trend shows a similar implication from the US market that shows increasing demand for suburban areas, even though the scale of Singapore’s central area is relatively small compared to the US major cities.

Transaction volume trends of private residential properties by locationSource: Created by the author based on URA data
Singapore has a unique housing system, as 77.9% of resident households reside in the public housing built by the Housing and Development Board (HDB) as of 2022. Moreover, the proportion of owner-occupied resident households is 89.3% (Singapore Department of Statistics, 2023). The HDB resale transaction number indicates a continuously increasing trend; the resale data for each HDB flat type discloses a steep increase in four- and five-room units compared to relatively small units, one- to-three-room units, and this trend accelerated after the outbreak of COVID-19 (Figure 2).

HDB resale transaction volume by the flat typeSource: Created by the author based on HDB data
On the other hand, the price indexes for the residential, office, and retail estate markets in Singapore display the different tendencies between residential properties and office and retail properties (Figure 3). The HDB resale price index and rental/sale index for private residential properties demonstrate an upsurge, especially the rental index for private housing; however, the price indexes for office and retail properties diminishes more sharply after the pandemic.

Property sales and rental price indices in Singapore, 2013-2022: (a) Sales price by property type; (b) Rental price by property typeSource: Created by the author based on URA and HDB data
The COVID-19 pandemic has led to drastic changes in travel behaviors, such as activity purposes, travel modes, and travel time and distances, with work-from-home modes and a growing desire for online shopping (Fatmi, 2020; Molloy et al., 2021; Shamshiripour et al., 2020). Molloy et al. (2021) elaborate that the average daily travel distances fell by 60% and over 90% for public transport. Moreover, long-distance external and intercity trips show a more significant decrease with a higher reduction in weekend mobility (Eom et al., 2022). The travel mode also has changed; with a sharp decline in transit ridership in many cities globally, the share of individual transport and non-motorized transport, such as private cars, motorbikes, cycling, and walking, has been multiplied as a substitute (Bereitschaft and Scheller, 2020; Shamshiripour et al., 2020). Lastly, Venter et al. (2020) reveal that recreational use of urban green spaces increased compared to the pre-pandemic period during the lockdown period in Oslo, Norway, emphasizing the importance of better accessibility to urban open spaces.
The Google Mobility Report provides the mobility pattern change during the period that imposes the policies to combat COVID-19 in Singapore, from February 15, 2020 to October 15, 2022. The data compares the percentage change from the baseline, which is the median value during the five weeks before the pandemic, for the corresponding day of the week (Google LLC, 2023b). The change patterns are categorized into six activities (Figure 4). The trips to workplaces sharply dropped after COVID-19 but have gradually increased, yet reached the pre-pandemic due to continuous remote work scheme. Furthermore, the mobility to retail and recreation facilities and public transport precipitously dropped with the execution of the COVID-19 policy measures; it has yet to return as before with the change in mobility patterns and travel modes. However, the trips to parks have soared for certain days, and the essential trips, such as travel to grocery markets and pharmacies, have recovered in a relatively short term.

Daily mobility patterns in Singapore during the COVID-19 pandemicSource: Created by the author from Google LLC (2023b)
The analysis of the passenger volume data for Mass Rapid Transit (MRT)/Light Rail Transit (LRT) and public buses in Singapore by the Land Transport Authority (LTA) describes the extent of traffic volume change using public transportation before and after COVID-19. The public bus and MRT/LRT make up 57.7% of the mode of transport to work, according to the Census of Population in 2020 (Singapore Department of Statistics, 2020). The comparison between the November 2019 and 2020 MRT/LRT passenger volume data elaborates on the decline of its use during COVID-19, such as a 46.7% decrease during the morning peak hours and a 42.3% decrease during the evening peak hours. The total traffic volume is relatively low during weekends, but the traffic volume was still reduced by 37.1% on average. The traffic volume change varies according to geographical location, describing the lesser decrease in outer residential new town areas. In contrast, the downtown and central areas display a relatively substantial decrease in MRT/LRT traffic volume on average (Figure 5).

Public transport volume change during COVID-19: (a) Weekdays and weekend MRT/LRT traffic volume in Nov, 2019 and Nov, 2020; (b) % Change of MRT/LRT traffic volume by subzones between Nov, 2019 and Nov, 2020Source: Created by the author based on LTA data
2. Hong Kong
The COVID-19 pandemic, which broke out in early 2020, hit Hong Kong’s property markets, but with a substantial time lag (Figure 6). Regardless of property types, both sales and rental price indices were stable or even showed a slightly increasing trend during the period between the first quarter of 2020 and the second quarter of 2021. Prices began to fall only after then, in the latter half of 2021. This trend contrasts with the case of many other global property markets, which were immediately hit by COVID-19. A primary reason is that Hong Kong’s property markets had already reflected a negative price shock caused by the Anti-Extradition Law Amendment Bill (Anti-ELAB) movement that occurred right before the outbreak of COVID-19. There was a sharp decline in price indices during the latter half of 2019 due to escalating Anti-ELAB protests, and this base effect could buffer part of the earlier pandemic shock (Guo, 2020).

Property sales and rental price indices in Hong Kong, 2013-2023: (a) Sales price by property type; (b) Rental price by property typeSource: Created from the Rating and Valuation Department (2023)
Overall, the impacts on property rental markets show a similar trend to sales markets since late 2019, but housing rents were more sensitive to the shocks than sales prices. During the Anti-ELAB and pandemic period, a number of non-local students and workers forming a major local tenant group went back to their residency outside Hong Kong, and a greater drop in housing rents reflects such reduced market demand. In contrast, demand for sales properties was relatively stable and less sensitive to the shocks, since most home buyers are local residents and their decision is based on long-term expectations.
In terms of property types, both the Anti-ELAB movement and the COVID-19 pandemic had a greater effect on commercial property markets than on housing markets. Office properties, whose prices increased by 38% between the first quarter of 2013 and the third quarter of 2019, experienced an 18% drop in price after the Anti-ELAB movement: the price index of 1.38 in the third quarter of 2019 fell to 1.13 in the third quarter of 2020. After then, the price index temporarily recovered to 1.25 in the first quarter of 2021 and this level was maintained for the following 1.5 years. The index then fell down to 1.18 by the first quarter of 2023, which is close to the level of the first quarter of 2017. Retail properties present a similar trend, but their prices fluctuated less than office prices. The price index reached its period high 1.19 in late 2018, but declined to 1.01 in the last quarter of 2019. The index was temporarily bounced back to 1.12 in the third quarter of 2021, but it currently fell to 0.97, below the level of the first quarter of 2013.
Changes in residential property prices were much less dramatic during the Anti-ELAB and pandemic period. The price index for private residential units remained stable for 2.5 years since the occurrence of the Anti-ELAB movement—covering the earlier pandemic period—and this contrasts with a sharp decline in retail and office property prices during the same period. However, entering into the later pandemic period, the index presents a clear declining trend: the index of 1.68 in the third quarter of 2021 dropped to 1.46 in the first quarter of 2023. Price shocks on residential properties were relatively moderate, since vandalism during the Anti-ELAB movement exclusively targeted commercial properties. Also, social distancing measures and work-from-home (WFH) arrangements during the pandemic could further reduce market demand for commercial properties while increasing the use value of housing.
Focusing on private residential properties right before and after the two events, their sales transaction volume did not fall immediately after the outbreak of the pandemic; it instead increased until the first half of 2021 and began to decline from the latter half of the same year, posing a time lag of >1 year in its negative response (Figure 7). Similarly, Hong Kong’s overall local housing prices also showed an increasing trend between the first quarter of 2020 and the second quarter of 2021, and then dropped sharply till the last quarter of 2022.

Market trends of private residential properties in Hong Kong, 2018-2023: (a) Transaction volume by location; (b) Sales price index by property typeNote: Classes A, B, C, D, and E refer to housing units with saleable area of <40 m2, 40-69.9 m2, 70-99.9 m2, 100-159.9 m2, and ≥160 m2, respectively.Source: Created from Midland Realty (2023) and the Rating and Valuation Department (2023)
The pandemic-caused market shock was greater in urban centers than in suburbs, though the margin is narrow. For example, the share of less urbanized New Territories (NT) in the number of property sales transactions slightly increased to 55-63% during the pandemic (2020-2023) from 53-59% in 2018/19; in contrast, the share of Hong Kong Island, which forms the city’s traditional urban center with Kowloon, declined to 12-17% from 15-20%. Increased popularity of NT may reflect a flattening bid-rent curve in Hong Kong’s local housing markets, associated with promoted WFH arrangements and increased public concerns about high infection risk in urban centers (Cheung et al., 2021; Gupta et al., 2022).
Regardless of housing size, private residential property prices remained relatively stable during the pandemic, showing a 5-9% drop in late 2022 from the early 2018 level. Among the five size classes, only class E properties—the smallest units whose saleable area is below 40 m2—show a divergent trend from the other four. During the pandemic, class E properties tended to be more shock-resilient than larger properties, but a lower base effect—an advance reflection of the shock in price—resulted in this lower sensitivity, rather than any structural change in consumer preference toward smaller housing units. In fact, class E properties experienced the most drastic price drop right before the pandemic, and showed the lowest sales price index as of the last quarter of 2022.
Mobility patterns during the pandemic present a clear contrast by the nature of activities. Overall, Hongkongers tended to substantially reduce inessential outdoor activities (visit to parks, transit ridership) or indoor activities subject to social distancing measures (retail/recreation, workplaces), while increasing essential outdoor activities (grocery/pharmacy) or trips to residence (residential) (Figure 8). The former show similar fluctuations time to time, whenever there were local outbreaks and they triggered stricter social distancing measures. Trips to residence or grocery/pharmacy stores increased during the pandemic, since citizens spent more time at home and demand for necessities increased. Interestingly, trips to parks increased regularly on certain days despite their overall decline, suggesting public need for open spaces amid social distancing and quarantine regulations.

Daily mobility patterns in Hong Kong during the COVID-19 pandemicSource: Created by the author from Google LLC (2023a)
Transit-based trips substantially declined throughout 2020 but gradually recovered to the baseline level by the end of 2021 (Figure 9). After then, the fifth wave of infections strongly discouraged transit use during the first half of 2022, but the shock faded away during the latter half of the same year and transit-based trips came back to the level close to the baseline level by the end of 2022. Looking into this trend by region, there was little spatial variation, and Hong Kong Island, Kowloon, and New Territories showed similar intra/cross-regional transit passenger travel patterns. Among the four transit modes, the pandemic-imposed shock was relatively small for taxis. In 2020, taxi-based journeys declined by 16%, but in 2022 recovered 84% of the 2019 level. In contrast, the other three transit modes—urban rail, franchised bus, and mini-bus—experienced a much sharper drop of 27-32% in 2020, and their demand in 2022 still remained 75-79% of the 2019 level. The relatively moderate shock to taxis seems to reflect public concerns about potential infection risk, with an intention to minimize close contact with unacquainted crowds in transit (Liu et al., 2022).

Trends of transit ridership in Hong Kong, 2012-2021: (a) By directionality; (b) By transit modeSource: Created by the author from the Transport Department of Hong Kong (2023a)
3. Synthesis
In sum, the pandemic caused a shock to property markets and travel volume/behavior in both cities, but its effects tended to be temporary rather than permanent. Singapore has experienced a significant increase in housing prices for both public and private housing, and its residential market has outperformed Hong Kong’s. Market demand for suburban housing has increased in both cities, consistent with other cities like New York and London. However, larger-sized units experienced a greater price increase in Singapore while demand for smaller-sized units was found to be more robust in Hong Kong. Also, in both cities, the pandemic strongly hit commercial property markets, and down-turning prices failed to find a momentum for rebounding until recently. Main factors that influence these similarities and disparities are likely to be the work-from-home trends as well as dynamic hypermobility of working professionals between global cities.
In terms of public mobility, both cities demonstrate that travel purposes matter. While the level of mobility to residences and daily necessities like grocery and pharmacy has been quite steady, mobility to retail and recreation has recovered more slowly than mobility to other places. Transit ridership experienced a drastic decline with strict social distancing measures in both cities. While Hong Kong showed a quicker recovery upon their easement, Singapore still has not returned to its pre-pandemic level. A potential explanation is that work-from-home patterns and alternative travel modes such as cycling have evolved differently in two cities.
However, many other factors would underlie such outcomes, and effective spatial interventions deployed with a reasonable long-term goal may be one of them. In the following two sections, we focus on each city’s planning strategies to create a resilient high-density urban environment.
Ⅲ. Singapore’s Holistic Urban Planning Strategies towards Sustainability
Singapore is a highly planned city where land use planning and development controls have been efficiently and systemically managed to overcome its geographic constraints and limited land area. The Singapore government has implemented self-sufficient new town projects in peripheral areas that accommodate major urban functions while solving the issue of housing scarcity. Earlier master plans in Singapore already aimed this concept through high-density new towns in suburban areas based on neighborhood unit planning since the 1970s (Manifesty and Park, 2022). These new towns promoted a walking-friendly environment with proximity to basic services. Furthermore, Singapore targets to make a ‘City in Nature’ that evolved as a sustained effort beginning from ‘Garden City’ in 1965 and a ‘City in a Garden’ (Ng, 2019). It promotes a range of green and open spaces, from national parks to neighborhood parks and green streetscapes, while retaining natural features in new towns. This section describes the urban planning strategies that have been implemented in Singapore and that can inspire our future planning to make our city more resilient, healthier, and sustainable.
1. Polycentric City Planning: 20-mins Towns and a 45-mins City
Since the 1980s, the Singapore government has encouraged the use of public transport to mitigate the issue of land scarcity and not expand the land area covered by roads by implementing an integrated public transport system that is deeply connected to residential areas (Manifesty and Park, 2022). In 2018, the Singapore government released Land Transport Master Plan (LTMP) 2040, which promotes 20-minute Towns and a 45-minute City, a similar concept to the 15-minute City. The LTMP 2040 aims to enhance the transportation system to be more convenient, well-connected, and fast; thus, the commuters can expect to reach their neighborhood center and daily amenities within 20 minutes and their workplace and business center within 45 minutes via walk-cycle-ride modes of transport (Land Transport Authority (LTA), 2018; Manifesty and Park, 2022).
The LTMP 2040 plan includes two main strategies to reach its target: (i) promotion of a mix-use development to locate urban facilities, such as schools, clinics, retails, food courts, and parks, closer to a residential unit to reduce travel distance, and (ii) enhancement of walk-cycle-ride options by providing infrastructure and implementing related policy to support active mobility modes (LTA, 2018; Manifesty and Park, 2022). Furthermore, the Singapore government has endeavored to construct business and commercial hubs outside of the CBD and planned to expand several new employment centers that will be well connected with new extension rail lines and walk-cycle-ride transport facilities (LTA, 2018) (Figure 10). To improve door-to-door connectivity and promote healthier transport modes, LTA plans to expand the cycling path network to more than 1000 km by 2040 and LTA already has built more than 440 km as of 2018, in addition to the effort to improve mass public transport and shared transport (LTA, 2018).

Strengthening regional centersSource: URA (2023a)
2. Land Use Planning: Promotion of Mixed-use Development with Greenery
The Singapore government has adopted flexible land use zoning to enhance the vibrancy and to reflect the frequently changing market demand. The planning authority in Singapore, Urban Redevelopment Authority (URA), introduced ‘White Site’ in 1995 to allow greater flexibility for private developers on the mix of uses and the respective quantum of floor space of each use within the total permissible gross floor area allowed for the whole site (Ong et al., 2004). By representing a shift away from rigid and prescriptive land use zoning to one that is flexible and reflects market demand, it reduced the risk for developers, simultaneously encouraging mix-land use for the site.
In addition, URA announced a Central Business District (CBD) Incentive Scheme in 2019, through Masterplan 2019, to encourage a mix-use district; thus, it would make the CBD a 24/7 vibrant place to work, live, and enjoy (URA, 2019). This scheme offers a 25 to 30% increase in gross plot ratio to encourage conversation of existing office buildings, which are over 20 years old and meet the minimum area requirement, into mixed-use developments with residential and hotel uses (JLL, 2019; Koh and Lee, 2022). It aims to rejuvenate CBD by embodying various activities, achieving better connectivity, and creating more intimate and humanscale development (URA, 2019). Moreover, this incentive scheme can result in the decentralization of offices in CBD to new employment hubs as the rental gap between CBD and suburban hubs with the withdrawal of office buildings in CBD and reduced office supply growth (JLL, 2019). Thus, this strategy can accelerate the development of decentralized hubs, providing proximity to jobs from home (Figure 11).

CBD incentive schemeSource: URA (2023b)
Finally, Singapore has aimed to incorporate plentiful green spaces and water bodies into the city and integrate green components in buildings to reach its aim of a City in a Garden, while Singapore has a very dense urban environment. Singapore accomplished a greenery increase, from 35% in 1986 to almost 50% in 2010, while the total population doubled (Khoo, 2019). Khoo (2019) mentioned three principal elements that enable to achieve greenery-Singapore: (i) hierarchy of greenery, such as national parks, regional parks, town parks, and neighborhood/community parks, (ii) linear greenery through road networks and park connector system, and (iii) green buffers between buildings and greenery on buildings, such as rooftop and vertical gardens. This hierarchical planning for green spaces allows HDB to enjoy lush greenery as well; HDB towns achieve lush and seamless connected green spaces through green connectors to have greenery closer to home, rooftop gardens above car parks, and sky gardens, besides town parks and neighborhood parks (Cheong, 2019).
Furthermore, URA launched the Landscaping for Urban Spaces and High-Rises (LUSH) program in 2009 and updated the version to LUSH 2.0 and LUSH 3.0 in 2014 and 2017, respectively, to encourage more sky rise greenery in private developments (URA, 2017). It includes the landscape replacement policy that requires developers to replace greenery lost due to development with greenery in other areas within the development (URA, 2014a). Under LUSH 3.0, vertical greenery and extensive green roofs will be counted forward, satisfying Landscape Replace requirements (URA, 2014b) (Figure 12). The LUSH program also provides Bonus Gross Floor Area (GFA) for rooftop refreshment areas and GFA exemption for communal ground gardens, sky terraces, rooftop pavilions, and green buffers (URA, 2014b). As a result, since 2009, 176 hectares of vertical greenery have been incorporated across different development types through the LUSH scheme (URA, 2020).

LUSH programSource: URA (2014b)
3. Residential Town Planning: A Focus on Self-sufficiency
Singapore’s public housing authority, Housing and Development Board (HDB), has promoted high-density public housing projects to provide affordable and stable housing and a well-designed living environment in Singapore. HDB has completed building more than 1.2 million flats in 24 HDB towns and three estates since the 1960s (HDB, 2021), aiming to alleviate the housing shortage and redistribute the population to suburbs (Seik, 2001). The HDB new towns have developed with a comprehensive approach-not only providing housing but also constructing a self-sufficient living environment. The new town planning is based on the neighborhood concept, which originated from Ebenezer Howard’s Garden City (Seik, 2001); thus, the HDB new towns accommodate the daily requirements of residents by locating a full range of facilities such as workplaces, schools, shops, and recreational amenities within the town (Hean, 2016). Such high-density residential towns function as major nodes within a compact and interrelated urban system-not low-density satellite new towns in a sprawling metropolitan area-while also well-connected with the central region with a transport hub (Hean, 2016; Seik, 2001).
As one of strategy to sustain a neighborhood with self-containment, new town planning followed the New Town Structure Model with a hierarchical structure (i.e., town, neighborhood, and precinct), which was developed in the late 1960s (Hean, 2016) (Figure 13). This model supports a comprehensive and integrated plan with efficient distribution of urban functions, residential, commercial, recreational, industrial, and institutional land uses (Seik, 2001). The town layer provides the overarching vision by identifying its historical features and guides for key corridors and landmarks. Each town has five to six neighborhoods, which scale around 4000 to 6000 residential units, and the neighborhood layer includes its neighborhood center, public spaces, shops, and communal facilities (Sim et al., 2002). Lastly, one neighborhood is divided into precincts, which comprise about 400 to 800 units; this precinct layer provides settings for neighborly interaction through community facilities like playgrounds, fitness corners, and community gardens (Hean, 2016; HDB, 2023). Furthermore, to enhance the distinctive identities of HDB towns, HDB promotes Town Design Guide, starting from Woodlands, which was announced in 2018 (HDB, 2018). Its guide sustains the structural framework in the town, neighborhood, and precinct scales to implement comprehensive planning with a wide range from the overall theme and vision to small-scale design such as precinct facilities, street furniture, and paving/signage design.

New town prototypeSource: Hean (2016), p.104
Ⅳ. Hong Kong’s Compact Urban Development Strategy
In Hong Kong, the COVID-19 pandemic brought a significant shock to the citizens’ daily lives, as discussed earlier. However, the pandemic did not necessarily cause any drastic change in Hong Kong’s pre-pandemic compact city development strategies. It instead further strengthened the rationale for them, and spurred the existing effort to create a “smart, green, and resilient” high-density urban environment, such as transit-centered planning and smart city development (Li et al., 2020). Hong Kong’s current long-term planning direction was set preceding the pandemic by more than a decade, and was in part a response to the Severe Acute Respiratory Syndrome—a shorter, localized version of the pandemic Hong Kong went through in 2003 (Matus et al., 2023). In this context, this section introduces Hong Kong’s established compact city development strategies at three different levels—regional, district, and building levels.
1. Regional Level: Transit-oriented Development
The Mass Transit Railway Corporation (MTRC) in Hong Kong is one of the world’s most competitive urban-rail service operators, thanks to its unique business model titled the “rail plus property” (R+P) model (Cervero and Murakami, 2008; Tang, 2017). The R+P model is a primary vehicle for Hong Kong’s transit-oriented development (TOD) and has been widely adopted throughout the city’s urban rail networks since MTRC was privatized in 2000. In essence, the model is a land value capture (LVC) scheme that integrates property and railway developments, involving three key parties: MTRC, the government of Hong Kong, and private developers (Figure 14). In Hong Kong, the government owns land and leases it to private parties with an up to 50-year contract. Under the R+P model, the government first grants MTRC exclusive development rights for land around transit stations at a “pre-development” price (Cervero and Murakami, 2009). Then, MTRC sells the development rights to qualified private developers at a “post-development” price, and uses the profits from land value differentials to support rail infrastructure development and service management.

Concept of the R+P modelSource: Created by the authors from MTRC (2023)
In addition, MTRC and private developers typically agree on a certain profit-sharing arrangement for future property development during bargaining, and this is to guarantee a “back end” share of revenues and assets (Cervero and Murakami, 2009). In turn, the government enjoys financial gains from land premiums, improved accessibility, and other returns from railway operations, since it is the majority shareholder of MTRC. Meanwhile, the R+P model would also reduce the government’s financial burden of subsidizing railway infrastructure developments (Tang et al., 2004). From societal and economic perspectives, the compact urban development and efficient use of scarce land resources encouraged by the R+P model improve environmental quality and the efficiencies of traffic and economic activities through reduced private vehicle use (Tang et al., 2004).
Overall, property development, property rental and management, and station commercial businesses make up >90% of MTRC’s annual mean profit between 2012 and 2021 (Figure 15). In particular, two property-related items of the three (the “P” component of R+P) collectively account for 61% of the profit, thanks to the R+P model. This joint share maintained stable between 2012 and 2021, but property rental/management has gradually overwhelmed property development in profit share with Hong Kong’s increasingly mature urban rail networks. Saturated local markets have encouraged MTRC to tap into Mainland China and other international markets (MTRC, 2022). In contrast to the stable performance of the “P” component, the “R” component—transport operations and station commercial businesses—has struggled with a sharp decline in profit since 2019. This is primarily due to reduced transit ridership during the Anti-ELAB movement and COVID-19 pandemic.

MTRC profit structure, 2012-2021: (a) Decomposition of mean annual profit; (b) Annual profit trendSource: Created from MTRC (2022)
With the increased adoption of the R+P model, many have asked its actual impacts on urban built environments. Recent empirical literature finds that in many Asian and Western cities the R+P model tends to enhance TOD through the following two channels (Sharma and Newman, 2017; Xue and Fang, 2017; Yang et al., 2020). First, R+P projects are often financially incentivized to incorporate TOD characteristics. For example, increased development density is positively associated with land values and transit ridership, and thus helps secure greater incomes from property development and transit service operation (Chang and Phang, 2017). Similarly, higher transit ridership and property prices could be sought with an improved pedestrian-friendly environment and attractive commercial and retail services near transit stations (Cervero and Murakami, 2009). Second, integrated rail-property development, coupled with improved transit accessibility, further enhances TOD features by intensifying residential density in proximity to transit stations (Yang et al., 2020). As stated in Hong Kong’s strategic territorial plan, a R+P model is an essential implementation vehicle for its long-term target to accommodate 75% of the city’s population and 85% of the city’s employment opportunities within the 500-meter catchment area from a given metro station (Planning Department, 2016).
The pursuit of TOD with the R+P model, however, may not ensure success unless several key conditions are met. For example, crucial factors behind Hong Kong’s successful R+P application include a large ridership, public land ownership, a prosperous property market, and rich experience in R+P development (Aveline-Dubach and Blandeau, 2019). Dissimilar regulatory and institutional settings may create hurdles in replicating Hong Kong’s experience in Mainland China and elsewhere (Haque et al., 2020; Xue and Fang, 2017). For example, railway operators in Mainland Chinese cities are often state-owned enterprises that cannot market-bid for land for commercial development, and ground/air rights above railway stations are not clearly stipulated (Song et al., 2021).
2. District Level: Pedestrian Network Design
As part of its compact city development strategy, Hong Kong has made an increased effort to create a favorable walking environment through two channels. Intervention based on physical planning and design is one of them. Hong Kong’s local planning regulations require a comprehensive pedestrian network plan that integrates “land use, transport, land management, economic, social, community, and environment aspects” as a core component of proposed development projects (Planning Department, 2021). A particular emphasis is placed on pedestrian walkways within the catchment areas of local transit hubs, with the guiding principles of linkage, safety, accessibility/comfort, and attractiveness/vibrancy.
Hong Kong has also promoted multi-grade, three-dimensional pedestrian networks to effectively separate pedestrian flows from on-road traffic and to create a safe, pedestrian-friendly walking environment. Conventional two-dimensional pedestrian network design lacks ground in Hong Kong’s urban centers with exceedingly high population/employment density. Instead, three-dimensional configuration, which consists of surface-level sidewalks, footbridges, and underpasses, has set an alternative local norm for site planning and urban design, and contributed to improved walkability and accessibility at the urban center (Zhao et al., 2021). The Hong Kong Planning Standards and Guidelines (Planning Department, 2015) specifies detailed design guidelines for elevated pedestrian networks. For example, it recommends that footbridges be perpendicular to the street and be linked to shopping malls or other commercial properties with lifts or escalators.
The other channel is policy-based intervention. The pedestrian schemes regulated by the Transport Department are a good example. The schemes designate a set of narrow street blocks with heavy vehicle/pedestrian traffic flows as full-time, part-time, and traffic-calming streets, and control vehicular traffic in terms of street access, vehicle types, and/or driving speed on a full-time or part-time basis (Transport Department, 2023b). Full-time pedestrian streets strictly prohibit vehicular access only except for emergency service vehicles, while part-time pedestrian streets do so only during certain hours of a day or certain days of the week. In contrast, traffic-calming streets do not restrict vehicular access itself, but regulate vehicle speed through speed tables, kerb build-outs, sharpened corners, and gateways. These schemes, which aim to promote walking and improve pedestrian safety/mobility by controlling inessential vehicular traffic, have been extensively implemented throughout the city since 2000 (Figure 16). Streets that are currently subject to the schemes include not only traditional urban cores (Causeway Bay, Central, Mong Kok, Jordan, and Tsim Sha Tsui) but also new town/suburban areas (Stanley, Sheung Shui, and Yuen Long).

Spatial distribution of pedestrian schemes in Hong KongSource: Created and adapted from MTRC (2023) and the Transport Department (2023b)
3. Building Level: Three-dimensional Mixed Land Use
Mixed land use is a norm in Hong Kong, and lies at the heart of the city’s compact urban development strategy. What distinguishes Hong Kong’s mixed land use from conventional practices is that it has been promoted not only through two-dimensional zoning regulations but also through a three-dimensional building-level land use control. The Outline Zoning Plan (OZP) is Hong Kong’s statutory land use plan upon which zoning regulations are based. By nature, the OZP segregates land by use, but offers substantial flexibility for vertical mixed land use (e.g., mixed-use residential buildings), as well as horizontal mixed use (e.g., cumulative/overlay zoning). For example, the OZP by default permits the commercial use of the lowest three floors of residential buildings, which are located in the group A residential zone enjoying a high floor-area ratio (Town Planning Board, 2021). Moreover, within zones designated as other specified uses (mixed use), the development of a new mixed-use building or the conversion of an existing building to a mixed-use building is allowed in principle, as long as residential and non-residential uses of a given building are physically segregated and placed on different floors (Town Planning Board, 2021).1)
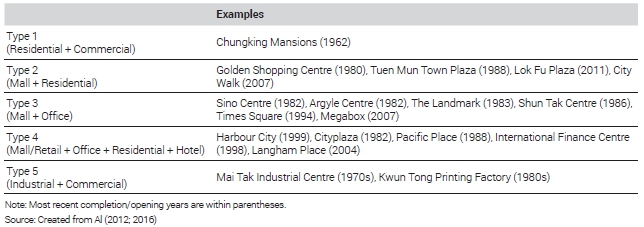
Mixed-use apartment buildings, where restaurants or other retail stores are seated at the lower levels of high-rise residential buildings, are the most common mixed-use building type in Hong Kong. However, mixed use at the building level is not just limited to the combination of residential and commercial uses, and many other patterns are also prevalent in the city, such as mall/office or industrial/commercial (Table 1). Among the five types listed in the table, accommodating other uses to industrial buildings is less common, partly due to institutional discouragement. Given the lower order of industrial use in zoning regulations, inviting higher order land uses (e.g., commercial or residential) to it has been permitted in a quite restricted manner.

Typology of mixed-use buildings in Hong Kong
However, there are signs of a shift in the city’s approach to the full/partial repurposing of industrial buildings. Hong Kong has undergone a massive deindustrialization process since the 1990s, resulting in underutilized industrial buildings (Xian and Chen, 2015). Meanwhile, demand for commercial and residential space has surpassed its supply. Faced with this imbalance, the Development Bureau has recently eased its regulations on the use of industrial buildings for alternative purposes (Information Service Department, 2019). Permitted alternative uses include art/cultural sectors, creative industries, and innovation/technology sectors, and this policy is likely to further promote the mixed use of existing industrial estates.
Ⅴ. Conclusions
The COVID-19 pandemic had a significant impact on our lives, and part of the impact may persist beyond the short term. We report that both property markets and public mobility were significantly affected by the pandemic and associated restrictive policy measures together with people’s behavioral changes. Commercial property markets have been slower for recovery compared with housing markets in both Singapore and Hong Kong. The negative shock on mobility and transit ridership was greatest during the lockdown periods, but both cities have returned to pre-COVID-19 levels while the recovery speed is not identical. In response to the long-lasting pandemic-induced shock, we may need a new or alterative planning paradigm that reflects changed public demand for urban infrastructure and services. As warned by public health experts, the pandemic we just went through may recur in the future, and it is essential to prepare long-term strategies to create more resilient urban environments against the threat.
Singapore and Hong Kong possess similarly high-density environment and have developed urban development and management for this environment. High-density and compact environment have been criticized for the main driver of virus spreads at the initial stage of the COVID-19 pandemic in many parts of the world. Nevertheless, Singapore and Hong Kong, which represent dense, global cities in Asia, have successfully coped with COVID-19. Hence, they can serve as a useful benchmark case for similar cities when discussing the direction of post-pandemic strategies. Comparing main planning strategies that two cities have developed to strength their resilience to future pandemics also provides meaningful lessons to planning scholars and practitioners across the globe.
Singapore has well managed urban development through a government-led hierarchical urban planning system. Singapore’s polycentric urban planning with several regional centers and mixed land use at a district level enables citizens to reduce travel distance to basic amenities and workplaces and promote non-motorized transport modes. Moreover, the scrutinized greenery planning, including hierarchical levels of greenery, linear greenery, and sky-rise greenery, allows citizens to relish open and green spaces on different scales, even in high-density urban environments. Lastly, self-sufficient residential town planning with a hierarchical planning structure helps reduce daily trips to essential amenities in a walking-friendly environment.
Hong Kong has incorporated various compact-city-development components into its strategic plan, under the slogan of a “smart, green, resilient” city. The pandemic functioned as momentum to further intensify and spur such preexisting practices. Hong Kong’s long-established compact development strategies touch at least three different levels—TOD at a regional level, pedestrian network design at a district level, and vertical mixed land use at a building level. Hong Kong’s central TOD promoter is the R+P model, which finances compact and orderly high-density urban development centering on major transit stations through land value capture. Hong Kong has also created a walkable urban environment through physical planning/design standards and time-differentiated vehicular traffic control at local economic centers. Furthermore, three-dimensional mixed land use at building/site levels is promoted through flexible zoning regulations and detailed planning/design guidelines.
While these planning strategies used in two cities did not directly target decreasing COVID-19 virus spreads and we do not intend to evaluate them, our discussions exemplify the sustainability-oriented, compact city as post-pandemic agenda for planning and implementation. Crucial components underlying such agenda in two cities include polycentric urban structure, self-contained neighborhoods, three-dimensional mixed land use, accessibility to green/open spaces, and pedestrian-friendly urban environments. On the one hand, these will reduce unnecessary travels within the city while ensuring access to necessities for residents’ daily lives. On the other hand, these will promote residents’ physical and mental wellbeing in healthy urban environment. As a result, cities pursuing this agenda will enhance their resilience to future pandemics. Of course, what we discussed is far from an exhaustive list of the key elements required for post-pandemic planning strategies. We expect that the list will be further extended incorporating other cities’ experiences, including those cases included in this special issue volume.
Acknowledgments
This paper was written based on the materials presented at the 2022 International Urban Conference hosted by Seoul Metropolitan Government and Korea Planning Association.
References
- Al, S., 2012. Factory Towns of South China: An Illustrated Guidebook, Hong Kong University Press.
-
Al, S., ed. 2016. Mall City: Hong Kong’s Dreamworlds of Consumption, Hong Kong University Press.
[https://doi.org/10.2307/j.ctv13gvhqt]

-
Aveline-Dubach, N. and Blandeau, G., 2019. “The Political Economy of Transit Value Capture: The Changing Business Model of the MTRC in Hong Kong”, Urban Studies, 56(16): 3415-3431.
[https://doi.org/10.1177/0042098018821519]
-
Balemi, N., Füss, R., and Weigand, A., 2021. “COVID-19’s Impact on Real Estate Markets: Review and Outlook”, Financial Markets and Portfolio Management, 35(4): 495-513.
[https://doi.org/10.1007/s11408-021-00384-6]
-
Bereitschaft, B. and Scheller, D., 2020. “How Might the COVID-19 Pandemic Affect 21st Century Urban Design, Planning, and Development?”, Urban Science, 4(4): 56.
[https://doi.org/10.3390/urbansci4040056]
- Cervero, R. and Murakami, J., 2008. Rail+ Property Development: A Model of Sustainable Transit Finance and Urbanism.
-
Cervero, R. and Murakami, J., 2009. “Rail and Property Development in Hong Kong: Experiences and Extensions”, Urban Studies, 46(10): 2019-2043.
[https://doi.org/10.1177/0042098009339431]
-
Chang, Z. and Phang, S.Y., 2017. “Urban Rail Transit PPPs: Lessons from East Asian Cities”, Transportation Research Part A: Policy and Practice, 105: 106-122.
[https://doi.org/10.1016/j.tra.2017.08.015]
-
Cheong, K.H., 2019. “Creating Liveable Density through a Synthesis of Planning, Design and Greenery”, in Dense and Green Building Typologies Research, Policy and Practice Perspectives, edited by T. Schröpfer and S. Menz, 7-12. Springer Singapore.
[https://doi.org/10.1007/978-981-13-0713-3_3]
-
Cheung, K.S., Yiu, C.Y., and Xiong, C., 2021. “Housing Market in the Time of Pandemic: A Price Gradient Analysis from the COVID-19 Epicentre in China”, Journal of Risk and Financial Management, 14(3): 108.
[https://doi.org/10.3390/jrfm14030108]
-
D’Lima, W., Lopez, L.A., and Pradhan, A., 2022. “COVID-19 and Housing Market Effects: Evidence from U.S. Shutdown Orders”, Real Estate Economics, 50(2): 303-339.
[https://doi.org/10.1111/1540-6229.12368]
-
Eom, S., Jang, M., and Ji, N.S., 2022. “Human Mobility Change Pattern and Influencing Factors during COVID-19, from the Outbreak to the Deceleration Stage: A Study of Seoul Metropolitan City”, Professional Geographer, 74(1): 1-15.
[https://doi.org/10.1080/00330124.2021.1949729]
-
Fatmi, M.R., 2020. “COVID-19 Impact on Urban Mobility”, Journal of Urban Management, 9(3): 270-275.
[https://doi.org/10.1016/j.jum.2020.08.002]
- Guo, J., 2020. Social Movement Effects on the Market Economy: The Impacts of Anti-Extradition Law Amendment Bill Movement on Hang Seng Properties Index.
-
Gupta, A., Mittal, V., Peeters, J., and Van Nieuwerburgh, S., 2022. “Flattening the Curve: Pandemic-induced Revaluation of Urban Real Estate”, Journal of Financial Economics, 146(2): 594-636.
[https://doi.org/10.1016/j.jfineco.2021.10.008]
-
Hamidi, S. and Zandiatashbar, A., 2021. “Compact Development and Adherence to Stay-at-home Order during the COVID-19 Pandemic: A Longitudinal Investigation in the United States”, Landscape and Urban Planning, 205: 103952.
[https://doi.org/10.1016/j.landurbplan.2020.103952]
- Haque, A., Sharna, F.K., and Khan, A., 2020. Does the Railway Plus Property Model of Hong Kong Replicable in Dhaka’s TOD?, The Jahangirnagar Review.
- Hean, C.K., 2016. “The Evolution of HDB Towns”, in 50 Years of Urban Planning in Singapore, edited by C.K. Heng, 1-322. World Scientic Publishing.
- JLL, 2019. Singapore’s CBD Revitalisation to Widen Its Lead as a Global Office Hub, Jones Lang LaSalle IP, Inc.
-
Khoo, T.C., 2019. “Building a City in Nature”, in Dense and Green Building Typologies Research, Policy and Practice Perspectives, edited by T. Schröpfer and S. Menz, 13-19. Springer Singapore.
[https://doi.org/10.1007/978-981-13-0713-3_4]
-
Kim, S., Goh, Y., and Kang, J.H.B., 2022. “Moving toward a Common Goal via Cross-sector Collaboration: Lessons Learned from SARS to COVID-19 in Singapore”, Globalization and Health, 18(1).
[https://doi.org/10.1186/s12992-022-00873-x]
-
Kissfazekas, K., 2022. “Circle of Paradigms? Or ‘15-minute’ Neighbourhoods from the 1950s”, Cities, 123.
[https://doi.org/10.1016/j.cities.2022.103587]
-
Koh, M. and Lee, A., 2022. “Strategies for Liveable and Sustainable Cities: The Singapore Experience”, in The Palgrave Encyclopedia of Urban and Regional Futures, edited by R. Brears, 1-28. Palgrave Macmillan Cham.
[https://doi.org/10.1007/978-3-030-51812-7_198-1]
-
Lee, J. and Lee, K.O., 2023. “Big Data for Housing and Their Interaction with Market Dynamics” (in press).
[https://doi.org/10.21203/rs.3.rs-2153935/v1]
-
Lee, K.O. and Lee, H., 2022. “Public Responses to COVID-19 Case Disclosure and Their Spatial Implications”, Journal of Regional Science, 62(3): 732-756.
[https://doi.org/10.1111/jors.12571]
-
Li, X., Nam, K.M., and Khoo, C.K., 2020. “Smart-city Vision and Strategy in Hong Kong”, in Smart Cities in Asia: Governing Development in the Era of Hyper-connectivity, edited by Y.M. Joo and T.B. Tan, Cheltenham: Edward Elgar.
[https://doi.org/10.4337/9781788972888.00010]
-
Liu, S. and Su, Y., 2021. “The Impact of the COVID-19 Pandemic on the Demand for Density: Evidence from the U.S. Housing Market”, Economics Letters, 207: 110010.
[https://doi.org/10.1016/j.econlet.2021.110010]
-
Liu, X., Dou, Z., Wang, L., Su, B., Jin, T., Guo, Y., Wei, J., and Zhang, N., 2022. “Close Contact Behavior-based COVID-19 Transmission and Interventions in a Subway System”, Journal of Hazardous Materials, 436: 129233.
[https://doi.org/10.1016/j.jhazmat.2022.129233]
-
Manifesty, O.R. and Park, J.Y., 2022. “A Case Study of a 15-minute City Concept in Singapore’s 2040 Land Transport Master Plan: 20-minute Towns and a 45-minute City”, International Journal of Sustainable Transportation Technology, 5(1): 1-11.
[https://doi.org/10.31427/IJSTT.2022.5.1.1]
-
Matus, K., Sharif, N., Li, A., Cai, Z., Lee, W.H., and Song, M., 2023. “From SARS to COVID-19: The Role of Experience and Experts in Hong Kong’s Initial Policy Response to an Emerging Pandemic”, Humanities and Social Sciences Communications, 10: 9.
[https://doi.org/10.1057/s41599-022-01467-z]
-
Molloy, J., Schatzmann, T., Schoeman, B., Tchervenkov, C., Hintermann, B., and Axhausen, K.W., 2021. “Observed Impacts of the Covid-19 First Wave on Travel Behaviour in Switzerland based on a Large GPS Panel”, Transport Policy, 104: 43-51.
[https://doi.org/10.1016/j.tranpol.2021.01.009]
-
Ng, L., 2019. “A City in a Garden”, in Dense and Green Building Typologies Research, Policy and Practice Perspectives, edited by T. Schröpfer and S. Menz, 5-6. Springer.
[https://doi.org/10.1007/978-981-13-0713-3_2]
-
Ong, S.E., Sing, T.F., and Malone-Lee, L.C., 2004. “Strategic Considerations in Land Use Planning: The Case of White Sites in Singapore”, Journal of Property Research, 21(3): 235-253.
[https://doi.org/10.1080/09599910500140122]
-
Seik, F.T., 2001. “Planning and Design of Tampines, an Award-winning High-rise, High-density Township in Singapore”, Cities, 18(1): 33-42.
[https://doi.org/10.1016/S0264-2751(00)00052-4]
-
Shamshiripour, A., Rahimi, E., Shabanpour, R., and Mohammadian, A. (Kouros), 2020. “How is COVID-19 Reshaping Activity-travel Behavior? Evidence from a Comprehensive Survey in Chicago”, Transportation Research Interdisciplinary Perspectives, 7: 100216.
[https://doi.org/10.1016/j.trip.2020.100216]
-
Sharma, R. and Newman, P., 2017. “Urban Rail and Sustainable Development Key Lessons from Hong Kong, New York, London and India for Emerging Cities”, Transportation Research Procedia, 26: 92-105.
[https://doi.org/10.1016/j.trpro.2017.07.011]
-
Sim, L.L., Yu, S.M., and Malone-Lee, L.C., 2002. “Re-Examining the Retail Hierarchy in Singapore: Are the Town Centres and Neighbourhood Centres Sustainable?”, The Town Planning Review, 73(1): 63-81.
[https://doi.org/10.3828/tpr.73.1.4]
-
Song, Y., de Jong, M., and Stead, D., 2021. “Bypassing Institutional Barriers: New Types of Transit-oriented Development in China”, Cities, 113: 103177.
[https://doi.org/10.1016/j.cities.2021.103177]
- Tang, B.S., 2017. “Leveraging Property Values for Metro Railway Development in Hong Kong: Experiences and Lessons”, in Routledge Companion to Real Estate Development, 12-27. Routledge.
- Tang, B.S., Chiang, Y.H., Baldwin, A.N., and Yeung, C.W., 2004. “Study of the Integrated Rail-property Development Model in Hong Kong”, The Hong Kong Polytechnic University.
-
Trasberg, T. and Cheshire, J., 2021. “Spatial and Social Disparities in the Decline of Activities during the COVID-19 Lockdown in Greater London”, Urban Studies, 60(8).
[https://doi.org/10.1177/00420980211040409]
-
Venter, Z.S., Barton, D.N., Gundersen, V., Figari, H., and Nowell, M., 2020. “Urban Nature in a Time of Crisis: Recreational Use of Green Space Increases during the COVID-19 Outbreak in Oslo, Norway”, Environmental Research Letters, 15(10).
[https://doi.org/10.1088/1748-9326/abb396]
-
Xian, S. and Chen, H., 2015. “Revitalisation of Industrial buildings in Hong Kong: New Measures, New Constraints?”, Habitat International, 47: 298-306.
[https://doi.org/10.1016/j.habitatint.2015.02.004]
- Xue, L. and Fang, W., 2017. Rail Plus Property Development in China: the Pilot Case of Shenzhen, World Resources Institute.
-
Yang, J., Zhu, L., Duan, Y., Zhou, J., and Ma, H., 2020. “Developing Metro-based Accessibility: Three Aspects of China’s Rail+ Property Practice”, Transportation Research Part D: Transport and Environment, 81: 102288.
[https://doi.org/10.1016/j.trd.2020.102288]
- Yörük, B.K., 2020. “Early Effects of the COVID-19 Pandemic on Housing Market in the United States”, SSRN Electronic Journal.
-
Yuen, S., Cheng, E.W., Or, N.H.K., Grépin, K.A., Fu, K.W., Yung, K.C., and Yue, R.P.H., 2021. “A Tale of Two City-states: A Comparison of the State-led vs Civil Society-led Responses to COVID-19 in Singapore and Hong Kong”, Global Public Health, 6: 1283-1303.
[https://doi.org/10.1080/17441692.2021.1877769]
-
Zhao, J., Sun, G., and Webster, C., 2021. “Walkability Scoring: Why and How Does a Three-Dimensional Pedestrian Network Matter?”, Environment and Planning B: Urban Analytics and City Science, 48(8): 2418-2435.
[https://doi.org/10.1177/2399808320977871]
-
Zhao, Y., 2020. US Housing Market during COVID-19: Aggregate and Distributional Evidence, IMF Working Paper, No. 2020/212.
[https://doi.org/10.5089/9781513557816.001]
- Google LLC, 2023a. “Google COVID-19 Community Mobility Reports: Hong Kong”, Accessed May 12, 2023. https://www.google.com/covid19/mobility/
- Google LLC, 2023b. “Google COVID-19 Community Mobility Reports: Singapore”, Accessed April 10, 2023. https://www.google.com/covid19/mobility/
- Housing and Development Board (HDB), 2018, September 4. “HDB Introduces Town Design Guides to Strengthen the Distinctive Identities of 24 HDB Towns”, https://www.hdb.gov.sg/cs/infoweb/about-us/news-and-publications/press-releases/hdb-introduces-town-design-guides
- HDB, 2021. “HDB Annual Report: Key Statistics FY21”, Accessed April 27, 2023. https://assets.hdb.gov.sg/about-us/news-and-publications/annual-report/2022/ebooks/Key%20Statistics%20FY21.pdf
- HDB, 2023. “HDB Town Planning”, Accessed April 20, 2023. https://www.hdb.gov.sg/about-us/history/town-planning
- Information Service Department of Hong Kong, 2019. “Industrial Building Uses Relaxed”, Accessed May 12, 2023. https://www.news.gov.hk/eng/2019/02/20190201/20190201_181524_014.html
- Land Transport Authority (LTA), 2018. “LTMP 2040 eReport”, Accessed April 26, 2023. https://www.lta.gov.sg/content/dam/ltagov/who_we_are/our_work/land_transport_master_plan_2040/pdf/LTA%20LTMP%202040%20eReport.pdf
- Mass Transit Railway Corporation (MTRC), 2022. “MTRC Annual Report 2021”, Accessed March 30, 2023. https://www.mtr.com.hk/en/corporate/investor/2021frpt.html
- MTRC, 2023. “Financial Sustainability”, Accessed March 30, 2023. https://www.mtr.com.hk/sustainability/en/financial-sustainability.html
- Midland Realty, 2023. “Statistics of Properties Transactions in Land Registry”, Accessed May 12, 2023. https://en.midland.com.hk/land-registry-record/12months.html?_ga=2.269210226.2055254090.1684385420-1173639241.1684385420
- Planning Department, Government of Hong Kong SAR, 2015. “Chapter 11 of the Hong Kong Planning Standards and Guidelines”, Accessed May 12, 2023. https://www.pland.gov.hk/pland_en/tech_doc/hkpsg/full/pdf/ch11.pdf
- Planning Department, Government of Hong Kong SAR, 2016. “Hong Kong 2030+: A Smart, Green and Resilient City Strategy”, Accessed March 30, 2023. https://www.pland.gov.hk/pland_en/p_study/comp_s/hk2030plus/document/Hong%20Kong%202030+%20A%20SGR%20City%20Strategy_Eng.pdf
- Planning Department, Government of Hong Kong SAR, 2021. “Chapter 8 of the Hong Kong Planning Standards and Guidelines”, Accessed May 12, 2023. https://www.pland.gov.hk/pland_en/tech_doc/hkpsg/full/pdf/ch8.pdf
- Rating and Valuation Department, Government of Hong Kong SAR, 2023. “Property Market Statistics”, Accessed May 12, 2023. https://www.rvd.gov.hk/en/publications/property_market_statistics.html
- Singapore Department of Statistics, 2021. “Singapore Census of Population 2020, Statistical Release 2: Households, Geographic Distribution, Transport and Difficulty in Basic Activities”, Singapore Department of Statistics, Ministry of Trade and Industry, Republic of Singapore, Accessed April 20, 2023. https://www.singstat.gov.sg/publications/reference/cop2020/cop2020-sr2/census20_stat_release2
- Singapore Department of Statistics, 2023. “Households-Latest Data”, Accessed April 20, 2023. https://www.singstat.gov.sg/find-data/search-by-theme/households/households/latest-data
- Town Planning Board, 2021. “Forms, Guidelines, Technical Documents and Reference Materials”, Accessed May 12, 2023. https://www.info.gov.hk/tpb/en/forms/master_schedule.html
- Transport Department, Government of Hong Kong SAR, 2023a. “Annual Transport Digest 2022”, Accessed May 12, 2023. https://www.td.gov.hk/mini_site/atd/2022/tc/index.html
- Transport Department, Government of Hong Kong SAR, 2023b. “Pedestrianisation”, Accessed May 12, 2023. https://www.td.gov.hk/en/transport_in_hong_kong/pedestrians/pedestrianisation/index.html
- Urban Redevelopment Authority (URA), 2014a, June 12. “Landscaping for Urban Spaces and High-Rises (LUSH) 2.0 Programme: Landscape Replacement Policy for Strategic Areas”, https://www.ura.gov.sg/Corporate/Guidelines/Circulars/dc14-12-original
- URA, 2014b. “Annex A: An Overview of the Lush Programme”, Accessed April 27, 2023. https://www.ura.gov.sg/-/media/User%20Defined/URA%20Online/media-room/2017/Nov/pr17-77a.pdf
- URA, 2017, November 9. “Updates to the Landscaping for Urban Spaces and High-Rises (LUSH) Programme: LUSH 3.0”, https://www.ura.gov.sg/Corporate/Guidelines/Circulars/dc17-06
- URA, 2019, March 27. “Rejuvenation Incentives for Strategic Areas: Central Business District (CBD) Incentive Scheme”, https://www.ura.gov.sg/Corporate/Guidelines/Circulars/dc19-04
- URA, 2020, August 25. “Seeing the City in a New Light”, https://www.ura.gov.sg/Corporate/Resources/Ideas-and-Trends/seeing-the-city-in-new-light
- URA, 2023a. “Strengthening Economic Gateways”, Accessed March 24, 2023. https://www.ura.gov.sg/Corporate/Planning/Master-Plan/Master-Plan-2019/Themes/Local-Hubs-Global-Gateways/Strengthening-Economic-Gateways
- URA, 2023b. “Work: Anywhere and Everywhere: Attractive Job Nodes”, Accessed April 12, 2023. https://www.ura.gov.sg/Corporate/Planning/Long-Term-Plan-Review/Space-for-Our-Dreams-Exhibition/Work/Attractive-Job-Nodes