Final publication date 30 Aug 2021
Factors Affecting on Inconsistency between Subjective Residential Satisfaction and Objective Residential Environment : Focused on Apartment Residents in Their 20s-40s in Seoul
Abstract
Physical residential environments and residential satisfaction are not only inconsistent, but there are still differences with each other, and identifying these characteristics is a significant part of the fundamental data of customized housing policies. This study aims to determine the types of discrepancies and analyze the determinants of discrepancies between physical residential environment and residential satisfaction. We analyzed residential satisfaction and physical residential environment using resident review data of 3,871 apartments in Seoul and public data on the 5,665 basic spatial unit in Seoul. As a result of the analysis, first, the agreement between residential satisfaction and the physical residential environments was determined to be inconsistent. Second, using the spatial distribution and the characteristics of the residential satisfaction in the residential environments, a few residential satisfaction heuristics were identified that affect an individual’s cognitive, and emotional behavior. Third, it was confirmed that the level of discrepancy was high when the residential apartments got older. In contrast, when the “residence size” and “residence value” were both low, the level of discrepancy was high. Furthermore, the level of discrepancy was high when public transportation access was high, whereas the level of discrepancy was high when bus access was low. Therefore, individual value judgments or hedonic value judgments were the primary determinants of the discrepancies, and the physical characteristics were rather heuristic, which can be perceived and acted upon differently depending on the conditions.
Keywords:
Residential Satisfaction, Physical Residential Environment, Spatial Inconsistency, Kappa Statistics, GWR키워드:
주거만족, 물리적 주거환경, 공간적 불일치, 카파통계량, 공간가중회귀Ⅰ. Introduction
The residential environment satisfaction data is prepared by comprehensively considering the satisfaction with the environment surrounding houses. Therefore, the residential satisfaction is an indicator that helps to identify the functions or facilities that are necessary according to the social classes and age groups of the residents, and thus is applicable to the preparation of the housing policies and plans. As the citizens’ interest is shifting from houses to residential environment, the residential environment satisfaction is considered as an indicator that is critical to the quality of life of the citizens (Ministry of Land, Infrastructure, and Transport, 2020). South Korea has conducted the Korea Housing Survey since 2006, and the residential satisfaction has continued to increase since the start of the survey.
The residential satisfaction is an important indicator that is used to evaluate the success of housing policies that are applied to various kinds of people (Mohit et al., 2010), and to identify the objective housing characteristics that are meaningful to various residents (Perez et al., 2001; Chen et al., 2013). The residential satisfaction is a universal indicator of the quality of life and a subjective indicator that represents how much an individual is satisfied with the overall environment surrounding their residential area, and the difference in the residential satisfaction is generally based on the difference in the physical residential environment (Hwang, 2013; Ahn, 2019). However, physical residential environment is not only coherent with the residential satisfaction (Shin and Nam, 2012), and there is a difference or inconsistency between the two factors. Therefore, understanding these characteristics is an integral part of the fundamental data for making the consumer-customized housing policies.
To provide customized residential services and to form high-quality comfort residential environment, the government has promoted various supporting policies in many areas, including the residential and social welfare services (Ministry of Land, Infrastructure, and Transport, 2019). However, the customized supporting policies are still insufficient in terms of the provision of residential service information. In particular, although it is necessary to review the microscopic neighborhood and provide the relevant information about the residential environment and the residential satisfaction, the information from the public sector is limited to the information provided in the unit of a administrative district (Gu). Therefore, the residents, the actual consumers, are not provided with the microscopic information about the neighborhood. This is because the implementation requires a huge amount of time and expense for the data collection and analysis (Shin et al., 2008; Jang, 2008). However, the recent development of the big data collection methods and the emergence of various residential platforms have helped to easily understand the subjective residential satisfaction of individuals.
The purpose of the present study was to investigate the distribution patterns of the residential satisfaction and the physical residential environment in microscopic spatial units, and to identify the characteristics that show inconsistency. The structure of this article is described below.
First, we reviewed the previous reports about the residential environment, which is a physical measurement, and the residential satisfaction, a subjective measurement, from the viewpoint of residential environment. Second, we describe the collection of the data used in this study and the framework of the data analysis. Third, we analyzed the pattern of inconsistency between the resident satisfaction and the physical residential environment at the level of the basic district, which is the unit of microscopic neighborhood environment to identify the characteristics of the inconsistency between the resident satisfaction and the physical residential environment. Finally, the results of the present study were summarized, and the implications of this study were described.
We verified the patterns of the spatial inconsistency between the resident satisfaction and the physical residential environment at the level of the basic district, which is a microscopic spatial unit, and identified the determinants of the inconsistency in order to provide the fundamental data for making the consumer-customized residential policies.
Ⅱ. Literature Review
1. Physical Residential Environment and Subjective Residential Satisfaction
Studies have been conducted in various areas with respect to the differences between the physical substance of urban residential spaces and the recognition characteristics of the users. van Acker et al. (2013) analyzed the consistency between the recognition of residential areas and the spatial characteristics objectively measured in the residential areas. Ma and Dill (2017) explored the inconsistency between the objective environment and the recognized environment, and investigated how the inconsistency affects people’s travel behavior. Many other researchers reported that subjectively recognized measurements have a greater impact on people’s behavior than the physical neighborhood environment that is measured objectively (Scott et al., 2007; Prins et al., 2009; Gebel et al., 2011; Dill and Voros, 2007; Beenackers et al., 2012).
With regard to the physical residential environment measurement, which may be considered as an objective measurement, Shin et al. (2008) evaluated the residential environment at the level of the neighboring sphere by using 4 indicators (safety, convenience, amenity and resource-saving) of the physical environment in 12 samples areas in Seoul. Lee et al. (2009) evaluated the residential environment in the entire Seoul area by using 5 indicators (safety, healthcare, convenience, amenity and sustainability) of the physical conditions, and investigated the agreement with the house price. These kinds of studies for evaluating the objective residential environment by using quantitative indicators are usually performed to identify the factors to the residential environment and the neighboring environment (Kang et al., 2008; Yoon and Jeong, 2013; Cho and Lee, 2015). Lee and Lee (2010) typified the single-person household in Seoul, and analyzed the characteristics of the residential environment of the single-person households by using the indicators corresponding to the individual areas of the residential environment evaluation. In the study, the authors evaluated the residential environment in the entire Seoul area by analyzing the safety, healthcare and amenity with a analytical technique applicable to small lattice units. However, they failed to reflect the subjective evaluation by the individual residents to the comprehensive assessment of the residential environment in the city unit.
The objective evaluation of the physical conditions of the residential environment should reflect the subjective evaluation by the residents. In that sense, surveys about the residential satisfaction of the residents have been performed in many studies. Kim and Lee (2007) conducted a survey with the residents in the Greater Seoul Area about the housing environment, the apartment complex and neighborhood environment, accessibility, community management, and financial factors in order to identify the factors to the residential satisfaction according to the spatial characteristics. Lee and Koh (2012) conducted a survey with the residents in the apartments located in Jeonju, Gunsan and Iksan to compare the residential satisfaction and analyze the difference between the housing types and between the areas. Most of the previous studies on the subjective satisfaction with the residential environment have been conducted to investigate the satisfaction of the residents depending on the space size or on the house type (Yoon, 2009; Park et al., 2009; Kim and Park, 2012, Yoo and Yang, 2013; Kwon and Park, 2014; Choi and Jeon, 2017).
Shin and Nam (2012) analyzed the coherence between the physical environment of the apartments in Seoul and the subjective evaluation by using the data from the building registers, resident registration population, digital maps, and the Seoul Survey in order to identify the impact of the objective evaluation factors on the subjective residential satisfaction. In the study, the authors analyzed the coherence between the physical environment and the residential satisfaction of the residents in the unit of the administrative ‘dong’ in 4 clusters, and investigated the mutual influences among the clusters. Bae and Park (2018) empirically analyzed the effects of the local characteristics of the administrative district on the residential satisfaction in the areas by using the Korea Housing Survey data for 2014. The authors reported that the subjective recognition by the residents have a greater impact on the residential satisfaction than the physical environment of the areas. Kim (2018) conducted a physical environment analysis and a survey with the residents in low-rise residential areas in order to understand the residential environment and the satisfaction factors of the baby boomers and the echo-boomers as well as the differences between the areas.
Many other studies have been conducted on the residential satisfaction, and most of the studies showed that the residential satisfaction is estimated differently depending on the demographic characteristics of individuals, the physical characteristics of houses, the residential features, the characteristics of the residential environment, and the policy factors such as the housing welfare policies (Yoon, 2010; Jeong and Jeong, 2015; Park and Lim, 2020).
2. Connection of Residential Environment Evaluation with Residential Satisfaction Measurement
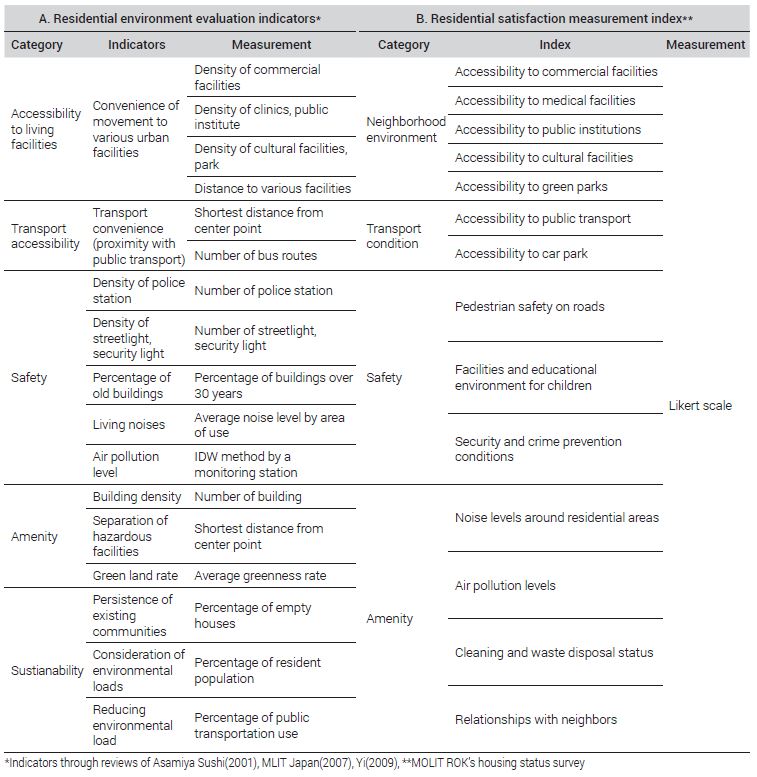
The indicators for measuring the residential environment based on the 4 residential environment concepts of WHO are discussed in terms of safety, healthcare, convenience and amenity. In 1985, the Tokyo Prefecture prepared a residential environment map based on 5 safety indicators, 4 healthcare indicators, 4 convenience indicators, and 5 amenity indicators so that the map may be used as an examination tool when preparing the Basic Plan for the Improvement of Residential Environment by establishing a residential environment assessment system (Asami, 2001).
The Ministry of Land, Infrastructure, Transport and Tourism (MLIT) of Japan, corresponding to the Ministry of Land, Infrastructure, and Transport of South Korea, provides the Residential Environment Evaluation Indicators to be used in the preparation of policies, wherein the indicators consist of 4 indicators in safety, 2 indicators in amenity, 2 indicators in sustainability, and 2 indicators in services for supporting daily living (MLIT, 2007).
In Korea, Lee et al. (2009) established 3 indicators in safety, 3 indicators in healthcare, 2 indicators in convenience, 3 indicators in amenity and 2 indicators in sustainability with reference to the previous studies (Oh et al., 1996; Kim and Park, 1997; Yang, 1997; Asami, 2001; Kang et al., 2008; Shin, 2008), and analyze the residential environment of Seoul by dividing the region into 400 m×400 m grids.
It is none other than humans that evaluate the residential environment in the sense that the residential environment is the collection of the environmental conditions in which humans live their life. Therefore, a survey is often performed to acquire the data about the psychological evaluation of the measurement items related to the residential environment. In Korea, the Ministry of Land, Infrastructure, and Transport conducts the Korea Housing Survey each year to measure the subjective satisfaction with the 14 items listed in Section B of Table 1.

Residential environment evaluation indicators and residential satisfaction measurement items
It is also important in the understanding of residential environment to investigate the relationship between the physical indicators of the objective residential environment and the psychological evaluation corresponding to subjective residential satisfaction. Taniguchi and Sadayuki (1987) and Asami (1999) analyzed the correlations between physical indicators and the subjective satisfaction, and found that physical indicators correlated with the subjective satisfaction are the residential building size corresponding to ‘habitability of complex,’ the residential building type corresponding to ‘healthcare,’ the distance to a train station corresponding to ‘commute convenience,’ and the distance to a medical facility corresponding to ‘shopping/medical service/welfare facility convenience.’
Methods such as correlation analysis, principle component analysis and factor analysis are generally applied to individual datasets in order to derive the relationships between the residential environment, which corresponds to the physical indicators, and the residential satisfaction, which corresponds to the psychological indicators. These methods are significant in that new comprehensive indicators are prepared as objective indicators, but they have the limitation that the meaning of the comprehensive indicators is difficult to understand (Asami, 2001).
3. Distinctiveness of Present Study
The previous studies mentioned above are significant as empirical studies on the objective measurement or the subjective evaluation of the residential environment. Studies related to the residential environment and the residential satisfaction have been conducted in various fields of urban planning, housing policies, geography and sociology according to the housing occupancy choices, housing type, the demographic and socioeconomic characteristics of the residents, and the spatial characteristics of the houses.
Despite the many discussions on the residential environment and the residential satisfaction in the previous studies, the approach in view of the inconsistency between the physical residential environment and the residential satisfaction has been taken very rarely. In addition, as mentioned earlier, the previous studies have limitations in deriving significant analytical results from the microscopic spatial units, because the analysis was performed in the spatial unit of the administrative district or dong due to the limitations of the established data.
Therefore, we compared the residential satisfaction, a subjective measurement, with the physical residential environment, an objective measurement, at the level of the basic district, 1) which is a microscopic spatial unit and the smallest unit for the neighborhood statistical service, in order to identify the determinants of the inconsistency between the residential satisfaction and the physical residential environment.
Ⅲ. Methodology
1. Framework for Data Establishment and Analysis
We established the data about the residential satisfaction and the physical residential environment in the unit of basic district, which is a microscopic spatial unit, in the entire Seoul region by the method described below.
First, the data regarding the residential satisfaction with the residential environment, corresponding to the subjective evaluation, was obtained from the residents’ reviews available on Zigbang.com, which is a representative proptech site. The residents’ reviews (as of June 2019) about the 4,453 apartment complexes in Seoul were collected through crawling and geo-coding to establish the residential satisfaction data,2) as shown in Figure 1. A total of 53,533 residents’ reviews were available about 3,871 apartment complexes among the 4,453 apartment complexes in Seoul, and the residential satisfaction data was established by using 49,080 reviews, removing the reviews with missing information items. The established residential satisfaction data of the residents in the apartments in Seoul consisted of the following information items; 1) location of apartment complex; 2) name of apartment complex; 3) personal properties of resident; and 4) scores for individual residential satisfaction items (① transportation conditions, ② neighborhood environment, ③ residential environment, and ④ apartment complex management) (see Figure 1).

Data collection process (as of June 2019)
Second, the data provided by the official website of Sewumteo (https://cloud.eais.go.kr/seoul) about the 3,871 apartment complexes selected from Zigbang.com was used to establish the physical residential environment of the individual apartment complexes,3) and the price data of the individual apartment complexes was established by using the past 10-year real transaction price available at the real transaction price opening system of the Ministry of Land, Infrastructure, and Transport.
Third, the data about the microscopic neighboring environment was established by using the public data from the Seoul Municipal Government and the Pedestrian Network Data of the Temporal and Spatial Analysis Laboratory for the individual basic districts in which the apartment complexes are located (5,665 basic districts).
Figure 2 shows the overall configuration of the analytical data used in the present study.

Research framework
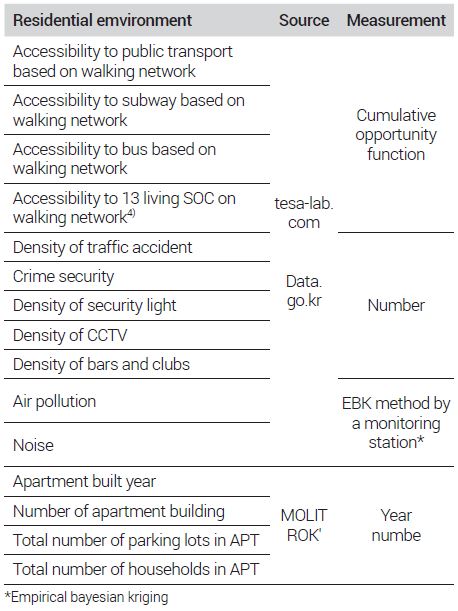
The data for the evaluation of the physical residential environment was established as shown in Table 2 with reference to the physical residential environment evaluation indicators and the residential satisfaction measurement items listed in Table 1.
Data items for evaluating residential environment
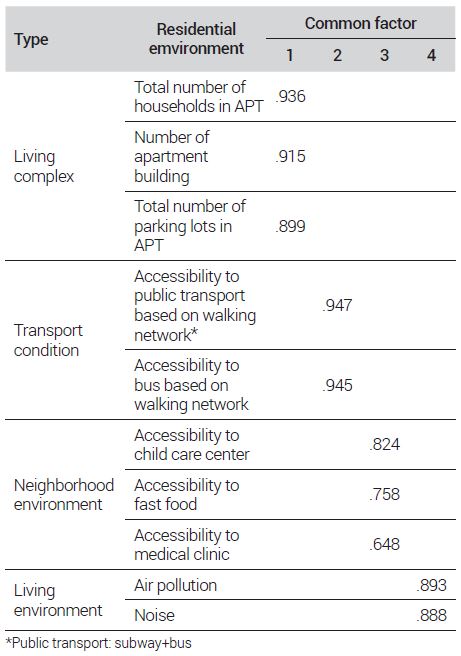
A factor analysis was performed to identify the common factors among the 27 items for evaluating the physical residential environment. The evaluation items, having different analytical units, were standardized, and a principal component extraction method was employed to construct a model. The varimax rotation was applied to avoid the multicollinearity problem among the factor scores, and the number of factors was fixed at 4 to compare the residential satisfaction (see Table 3).
Common factors of residential environment
In this study, the determinant of the factor loading was set to be ±0.6 with reference to the previous studies MacCallum et al., 2001; Tabachnick and Fidell, 2007), and the factor loadings were used as a weight for the evaluation of the physical residential environment for each factor (McGinn et al., 2007). The weights based on the factor loadings were used to improve the limitations of the standardized summated scale in which the standardized scores are summed up (Lee and Shim, 2016).
The standardized scores of four factors (10 physical residential environment items) and the factor loading values were used to calculate the physical residential environment scores of the individual factors, as shown in Equation (1), and the scores were summated (Lee et al., 2009).
| (1) |
To compare the residential satisfaction with the physical residential environment, the z-scores for the individual items, ‘apartment complex,’ ‘transportation,’ ‘neighborhood environment,’ and ‘residential environment,’ were standardized, and the total score was calculated.
| (2) |
2. Analytical Method
First, to investigate the consistency between the residential satisfaction, a subjective measurement, and the physical residential environment, an objective measurement, we used the Kappa statistic proposed by Cohen (1960) (Kim et al., 2012). The Kappa statistic is often used as a measure of agreement when the measurements are categorical data, wherein the agreement refers to the corrected agreement representing the probability that the evaluators accidently classify a data into the same category. The agreement is a measure used in the reliability evaluation with regard to how much the results obtained from repeated measurements with a sample agree with each other. The intra-class correlation coefficient, proposed by Fisher (1925), is often used as a correlation coefficient to show the reliability in continuous data, and the Kappa statistic is generally used to present the agreement in categorical data.
| (3) |
The Kappa statistic can have a value between –1 an 1, wherein the value 1 means actual agreement among all, 0 means agreement by perfect coincidence, and a negative value means contrasting opinions. The Kappa statistic may be applied to various studies, and the agreement value is usually interpreted according to the 6-step classification standards provided by Landis and Kock (1977). The Kappa value is ≤0 for poor agreement, 0.0-0.20 for slight agreement, 0.21-0.40 for fair agreement, 0.41-0.60 for moderate agreement, 0.61-0.80 for substantial agreement, and 0.81-1.0 for almost perfect agreement. In the present study, the Kappa statistic was employed to determine the agreement between the residential satisfaction and the physical residential environment (McGinn et al., 2007; McGinn et al., 2008).
Second, to investigate the types of the inconsistency between the residential satisfaction and the physical residential environment, the subjects that showed inconsistency were identified through the portfolio analysis. The portfolio analysis is an analytical method in which two variables are categorized in each of the quadrants of a graph. The method was developed for the portfolio investment in the fields of management and finance (Kim et al., 2015). The portfolio analysis has been applied to various areas, for example, the analysis of land use and awareness of urban spaces (Shin et al., 2011; and Jang et al., 2017). In the present study, the x-axis represented mean values of the residential satisfaction, and the y-axis represented the mean values of the physical residential environment in order to understand the types of inconsistency. The inconsistency was high in the areas where the residential satisfaction was high but the physical residential environment was low (the second quadrant) and where the physical residential environment was high but the residential satisfaction was low (the fourth quadrant) (see Figure 3).

Portfolio analysis for inconsistency type
Third, the geographically weighted regression (GWR) model was used to identify the determinants of the apartment complex showing the spatial inconsistence. Since the purpose of the present study was to identify the determinants of the inconsistence, the overall model was understood by using the ordinary least square method (OLS), and then the GWR model was applied to identify the determinants of the inconsistence with respect to geographic location i. The GWR model depending upon the spatial location is expressed as in Equation (4).
| (4) |
| (5) |
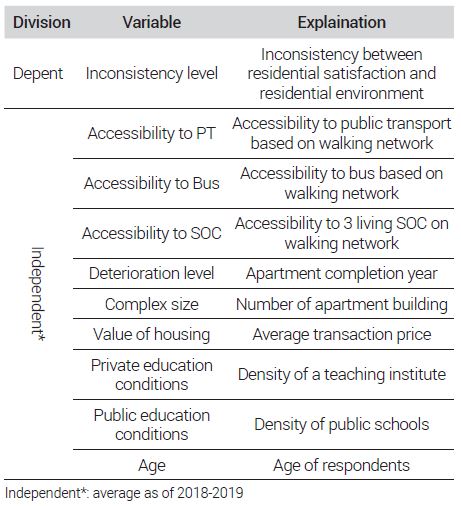
The GWR model, representing the aggregates of the local spatial regression model, is based on the regression analysis method for describe the regression coefficients of the individual spaces (Fotheringham et al., 2002). Assuming that the regression coefficients are different spatially, the center of the regression analysis is determined in a subject area, and a regression analysis is performed within a reference distance from the center. The regression coefficients are calculated by Equation (5) above by the adjacent values within a specific range at the location i and the neighboring weight matrix W(i). Table 4 shows the key variables of the model used in the present study.
Independent and dependent variables in the model
Ⅳ. Results and Discussion
1. Demographic Characteristics and Agreement in Data
The demographic characteristics of the analytical data used in this study are described below. With regard to the 49,080 residents’ reviews, the residents included 33% in their 20s, 42% in their 30s, 19% in their 40s, 5% in their 50s, and 1% in their 60s or higher ages, indicating that the residents in their 20s and 30s accounted for a large proportion. With regard to the gender, the males accounted for 32% and the females 68%, indicating the female residents had a larger proportion. In addition, 53% of the residents were those who were married, and 47% of the residents were those who were not married. With regard to the residence type, 54% of the residents were living in their own houses, and 46% of the residents were living in deposit-based or monthly rent houses.
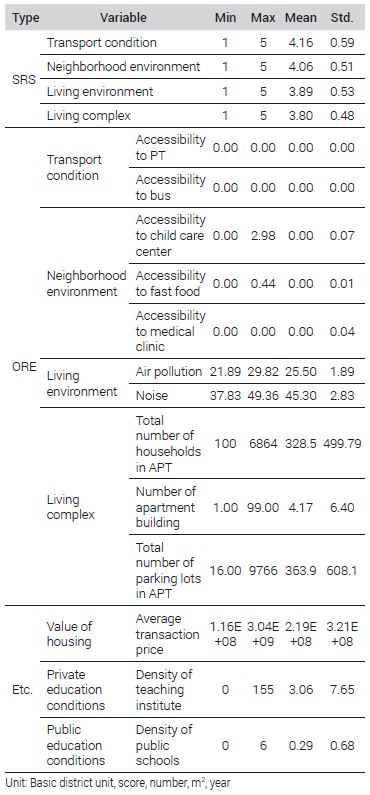
Table 5 shows the basic statistics of the data about the residential satisfaction and the physical residential environment in the unit of the basic district. A reliability analysis was performed to investigate the internal consistency of the residential satisfaction data gathered from zigbang.com. The results of the reliability analysis showed that Cronbach’s alpha was .804, indicative of reliability, and that the internal consistency was also high.
Descriptive statistics
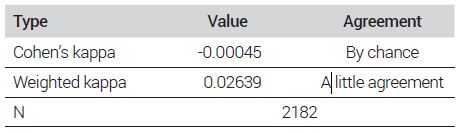
In the present study, we measured the agreement between the residential satisfaction, a subjective measurement, and the physical residential environment, an objective measurement, in terms of the Kappa statistic. Since the application of the Kappa statistic require that the data should be categorical, the values of the physical residential environment, which are continuous data, were converted to categorical data for the analysis. The “psy” package of the R-3.4.4 software program was employed for the analysis of the Kappa statistic, and the analytical results are shown in Table 6.
Agreement analysis using kappa’s statistic
The analytical results showed that the agreement between the residential satisfaction and the physical residential environment was classified as ‘poor agreement’ according to Landis and Kock (1977) based on the simple Kappa statistic, and ‘slight agreement’ based on the weighted kappa statistic. This suggests that some parts of the data may not be verified by the consistency-inconsistency judgment according to the Kappa statistic.
2. Comparison of Residential Satisfaction with Physical Residential Environment
First, the residential satisfaction and the physical residential environment were compared by collecting the data for the basic districts in 4 sections: ① transportation, ② neighborhood environment, ③ residential environment, and ④ apartment complex management (see Figure 4). To avoid the intentional intervention by the residents with the responses regarding the residential satisfaction, we used the data acquired from the residents living in deposit-based or monthly rent houses. In the section of the transportation conditions, the residential satisfaction and the physical residential environment showed inconsistent patterns in the basic districts in the south of the Han River, including Gwanak, Seocho, Gangnam and Songpa. In the section of the neighborhood environment, the residential satisfaction and the physical residential environment showed inconsistent patterns in the basic districts in Seocho, Gangnam and Songpa. In the section of the residential environment, the residential satisfaction and the physical residential environment showed inconsistent patterns in the basic districts in Eunpyeong, Dobong, Gangnam and Songpa. In the section of the apartment complex environment, the residential satisfaction and the physical residential environment showed inconsistent patterns in some basic districts in Guro and Gumcheon, but the insistent patterns were not distinctive in general.

Comparison of subjective residential satisfaction and objective residential environment by basic distict zone
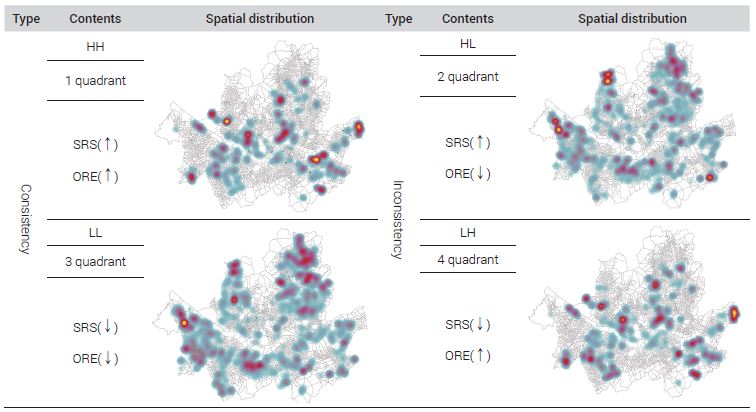
Second, to investigate the consistency-inconsistency patterns between the residential satisfaction and the physical residential environment of apartment complexes, a portfolio analysis was performed by using the comprehensive scores of the residential satisfaction and the physical residential environment (see Table 7). The patterns showing the consistency between the residential satisfaction and the physical residential environment correspond to the first and third quadrants, wherein both the residential satisfaction and the physical residential environment are positive in the first quadrant and both of them are negative in the third quadrant. The patterns showing the inconsistency between the residential satisfaction and the physical residential environment correspond to the second and fourth quadrants, wherein the residential satisfaction is higher than the average and the physical residential environment is lower than the average in the second quadrant, and the residential satisfaction is lower than the average and the physical residential environment is higher than the average in the fourth quadrant. The HH type apartment complexes, found in the first quadrant where both the residential satisfaction and the physical residential environment are higher than the average, are concentrated in Sangam, Gongdeok, Gajua, Jamsil, Dogok, Gangil, Godeok, etc. The LL type apartment complexes, found in the third quadrant where both the residential satisfaction and the physical residential environment are lower than the average, are concentrated in Gwanak-gu, Magok in Gangseo-gu, Eungam and Enpyeong New Towns, Dobong-gu, Nowon-gu, and Jungrang-gu.
Result of portfolio analysis
The HL type apartment complexes, found in the in the second quadrant where the residential satisfaction is higher than the average and the physical residential environment is lower than the average, are concentrated in Jangji-dong in Songpa-gu, Magok in Gangseo-gu, Enpyeong New Town, Dobong-gu and Nowon-gu. The LH type apartment complexes, found in the in the fourth quadrant where the residential satisfaction is lower than the average and the physical residential environment is high than the average, are concentrated in Suseo, Daechi, Daerim, Daehak-dong in Gwanak-gu, Godeok and Gangil. In particular, residents in some areas, having the same physical residential environment, showed different degrees of residential satisfaction.
The respondents of the HH type, corresponding to the first quadrant, accounted for 22.31% of all the respondents; those of the HL type, corresponding to the second quadrant, 42.73%, those of the LL type, corresponding to the third quadrant, 23.96%, those of the LH type, corresponding to the fourth quadrant, 11.00%, indicating that more 65% of the residents living in the apartment complexes in Seoul are satisfied with the residential environment. Particularly, among the residents living in the areas where the physical residential environment is low, those who are satisfied with the residential environment are more than those who are not.
In addition, the pattern distribution according to the physical residential environment showed that the residential satisfaction is different even in the same physical residential environment, as indicated by the comparison of the HL type of the second quadrant with the LL type of the third quadrant, and the comparison of the HH type of the first quadrant with the LH type of the fourth quadrant. This indicates that the residential satisfaction has heuristic characteristics such that the same physical characteristics may be recognized or may function differently depending on the individuals’ conditions.
3. Determinants of Inconsistency Between Residential Satisfaction and Physical Residential Environment
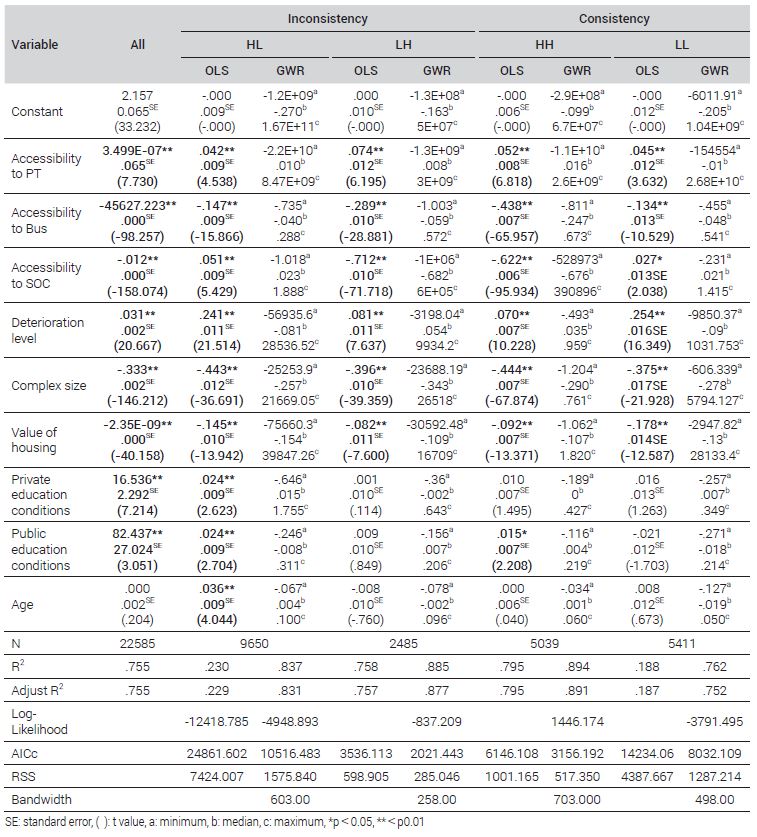
An OLS anslysis was performed regarding the disagreement level to identify the determinants between the residential satisfaction and the physical residential environment, and a GWR analysis was performed to identify the determinants according to the inconsistency types. The analyses were performed separatepy with the overall model, the two inconsistent types (HH and LH types) and the two consistent types (HH and LL types), and the analytical results are shown in Table 8.
Determination of inconsistency between subjective residential satisfaction and objective residential environment
To investigate the multicollinearity of the variables applied to the model, the Variance Inflation Factor (VIF) value was calculated. Among the variables applied to the model, the ‘total number of parking lots in the apartment complex,’ one of the apartment complex-related factor, and the ‘total number of households,’ which is related to the scale, were excluded from the analytical model, because their VIF was higher than 10. The ‘accessibility to public transportation,’ ‘accessibility to bus,’ ‘accessibility to living SOC,’ ‘deterioration level (apartment completion year),’ ‘number of apartment buildings,’ ‘value of housing (average transaction price),’ ‘conditions for private education,’ ‘conditions for public education,’ and ‘age (age of respondents)’ showed a VIF value lower than 10, indicating that they lacked a multicollinearity issue.
The coefficient of determination (R2), meaning the explanation power of the provided model, was 0.755, showing that the explanation power was 75.5% (F=6897.712, p=.000). The Durbin-Watson value, calculated to determine whether the residuals of the estimation model are independent, was 0.248, which is indicative of autocorrelation between the residual terms. To overcome the bias of the model, a spatial GWR analysis was performed with each of the sub-models for the different types.
In the GWR analysis, different regression coefficients are derived from all the variables, because the spatial characteristics of all the spatial units applied to the analysis are taken into consideration. Compared with the OLS model, the Adjust R2, AICc and RSS were improved in the GWR model, justifying the application of the GWR model. The results of the GWR analysis are described below.
First, the analysis of the determinants of the inconsistency in the overall model showed that all the variables are significant, except the ‘age of respondent.’ The ‘accessibility to bus,’ ‘accessibility to living SOC,’ ‘number of apartment buildings,’ and ‘value of housing (average transaction price)’ showed a negative effect, meaning that the inconsistency was increased as the accessibility to bus, the accessibility to living SOC, the number of apartment buildings in the complex, and the real transaction price of the apartment were decreased. On the contrary, the ‘accessibility to public transportation (accessibility to means of public transportation such as subway and bus),’ ‘apartment built age (age of apartment buildings),’ ‘conditions for private education (density of private education institutes)’ and ‘conditions for public education (density of elementary, middle and high schools)’ showed a positive effect, meaning that the inconsistency was increased as the scores of these variables were increased.
Second, for the HL type (residential satisfaction↑, physical residential environment↓), all the variables were found to be significant determinants to the inconsistency. In contrast to the overall model, the ‘accessibility to living SOC’ showed a positive effect, and the inconsistence was increased as the age of the respondent was increased. On the contrary, for the LL type (residential satisfaction ↓, physical residential environment↑), corresponding to the HL type, the analytical results were the same as the HL type, except the ‘conditions for private education’ and ‘conditions for public education,’ which correspond to educational conditions, and ‘the age of respondent.’ These results suggest that unlike the LL type where both the residential satisfaction and the physical residential environment are low, the educational conditions and the age of the respondent affect the inconsistency in the HL type where the residential satisfaction is higher although the physical residential environment is high.
Third, for the LH type (residential satisfaction↓, physical residential environment↑), the ‘accessibility to public transportation,’ ‘accessibility to bus,’ ‘accessibility to living SOC,’ ‘deterioration level (apartment completion year),’ ‘number of apartment buildings,’ and ‘value of housing (average transaction price)’ were found to be the determinants of the inconsistency. The ‘accessibility to bus,’ ‘accessibility to living SOC,’ ‘number of apartment buildings,’ and ‘value of housing (average transaction price)’ showed a negative effect, while the ‘accessibility to public transportation’ and ‘deterioration level (apartment completion year)’ showed a positive effect. For the HH type (residential satisfaction↑, physical residential environment↑), corresponding to the LH type, the analytical results were the same as the LH type, except the ’conditions for public education,’ which is related to education. In particular, as for the HL type mentioned earlier, the ‘conditions for public education’ was found to be a factor to the inconsistency. The conditions related to education affected the inconsistency in the HH type where both the residential satisfaction and the physical residential environment are high, unlike the LH type where the residential satisfaction is low but the physical residential environment is high.
Generally in the models, the ‘accessibility to public transportation’ and ‘deterioration level (apartment completion year)’ showed a positive effect, while the ‘accessibility to bus,’ ‘number of apartment buildings,’ and ‘value of housing (average transaction price)’ showed a negative effect. This means that the inconsistency is high when the apartment building is deteriorated, but the inconsistency is low when the ‘number of apartment buildings (size of apartment complex)’ and ‘value of housing (average transaction price)’ are low.
In addition, the inconsistency is high when the accessibility to public transportation, combining subway and bus, based on walking network, is high. On the contrary, the inconsistency is high when the accessibility to bus based on walking network is low. These results suggest that the convenience in using public transportation, including subway and bus, has both positive and negative impacts on the residential satisfaction (Lee et al., 2010; Jeon, 2016; Jang and Roh, 2015; Doh et al., 2015; Kang and Seo, 2016). However, the inconsistency is high when the accessibility to bus based on walking network is low. The transport environment factor related to accessibility to transport may be a determinant that increases the inconsistency because the residents living in the areas where the accessibility to bus is low show a higher dependence on privately-owned vehicles in general (Jo et al., 2010).
Ⅴ. Conclusions and Implications
The residential satisfaction, which is a measurement of subjective feelings of individuals, undergoes cognitive, emotional and behaviroal processes, and thus many studies on the residential satisfaction have been conducted based on the objective, subjective and personal attributes. Nevertheless, the empirical discussion is still insufficient in terms of the spatial inconsistency between the residential satisfaction and the physical residential environment.
Therefore, we conducted the present study to compare the subjective residental satisfaction with the objective physical residential environment to investigate the inconsistency types in the spatial distribution pattern and identify the determinants of the inconsistency. The key results of the present study are summarized below.
The inconsistency between the subjective residental satisfaction and the objective physical residential environment was analyzed, and the simple Kappa statistic showed disagreement and the weight Kappa statistic showed slight agreement. This means that there are both consistency and inconsistency between the residential satisfaction and the physical residential environment.
Second, the residental satisfaction and the physical residential environment were compared and the characteristics of their spatial distribution were investigated at the level of the basic district, which is a microscopic spatial unit. In the section of the transportation conditions, the residential satisfaction and the physical residential environment showed inconsistent patterns in the basic districts in the south of the Han River, including Gwanak, Seocho, Gangnam and Songpa. In the section of the neighborhood environment, the residential satisfaction and the physical residential environment showed inconsistent patterns in the basic districts in Seocho, Gangnam and Songpa. In the section of the residential environment, the residential satisfaction and the physical residential environment showed inconsistent patterns in the basic districts in Eunpyeong, Dobong, Gangnam and Songpa. In the section of the apartment complex environment, however, the patterns of inconsistency between the residential satisfaction and the physical residential environment were not distinctive.
Third, a portfolio analysis was performed to identify the patterns of inconsistency between the residential satisfaction and the physical residential environment. The respondents of the HH type, corresponding to the first quadrant, accounted for 22.31% of all the respondents; those of the HL type, corresponding to the second quadrant, 42.73%, those of the LL type, corresponding to the third quadrant, 23.96%, those of the LH type, corresponding to the fourth quadrant, 11.00%, indicating that more 65% of the residents living in the apartment complexes in Seoul are satisfied with the residential environment. Particularly, among the residents living in the areas where the physical residential environment is low, those who are satisfied with the residential environment are more than those who are not. In addition, the residential satisfaction was found to be significantly different among the residents living in the basic districts of the same physical residential environment. This means that the residential satisfaction is dependent upon the cognitive, emotional and behavioral processes of different groups, generations, age groups and stages of the life cycle, indicating that the residential satisfaction has heuristic characteristics such that the same physical characteristics may be recognized or may function differently depending on the individuals’ conditions.
Fourth, the determinants of the inconsistency between the residential satisfaction and the physical residential environment were identified with respect to the overall model and the inconsistency types. In the overall model about the inconsistency, the inconsistency was decreased as the accessibility to bus, the accessibility to living SOC, the number of apartment buildings in the complex, and the real transaction price of the apartment were decreased. On the contrary, the inconsistency was increased as the ‘accessibility to public transportation (accessibility to means of public transportation such as subway and bus),’ ‘apartment built age (age of apartment buildings),’ ‘conditions for private education (density of private education institutes)’ and ‘conditions for public education (density of elementary, middle and high schools)’ were increased. The analysis with the sub-models of the inconsistency types showed that the inconsistency was increased, as the age of the apartment building was increased and the ‘number of apartment buildings (size of apartment complex)’ and ‘value of housing (average transaction price)’ were decreased. The inconsistency is high when the accessibility to public transportation, combining subway and bus, based on walking network, is high. On the contrary, the inconsistency is high when the accessibility to bus based on walking network is low. These results suggest that despite the positive aspects, the convenience in using public transportation, including subway and bus, has both positive and negative impacts on the residential satisfaction, and that the transport environment factor is also as a determinant that increases the inconsistency .
In summary, we investigated the patterns of the spatial inconsistency between the residential satisfaction and the physical residential environment as well as their characteristics. The distinctive patterns of inconsistency were found in the sections of transport conditions, neighborhood environment and residential environment, but the overall distribution of the satisfaction related to the apartment complex management was sporadic. The results of the present study also showed through the identified types of the residential satisfaction that the resident satisfaction with the residential environment are heuristic in the cognitive, emotional and behavioral aspects of individuals. This is because the concept of satisfaction itself is a psychological process incorporating the expectation about a subject of evaluation (Parker and Mathews, 2001). Among the determinants of the inconsistency between the residential satisfaction and the physical residential environment, the ‘accessibility to public transportation’ based the walking network, which has both positive and negative effects on the satisfaction with the residential environment, and the ‘deterioration level (apartment completion year),’ which includes hedonic elements of residence preference, showed a positive correlation with the inconsistency between the residential satisfaction and the physical residential environment. This finding suggests that the two factors are extremely different impacts on the recognized residential satisfaction with the physical residential environment. On the other hand, the ‘accessibility to bus’ based on the walking network, ‘number of buildings in the apartment complex’, which is a premium factor of apartments, and ‘value of housing (average transaction price),’ an asset element, showed a negative correlation with the inconsistency between the residential satisfaction and the physical residential environment. This finding support the previous report that the size of the apartment complex affects the value of housing (average transaction price) (Kim and Ahn, 2010). Considering that buses provide transportation services to the residential areas of the mid-income and low-income classes (Yoon and Jung, 2013; Kang, 2021), the locational attractiveness of the areas may have been reflected to the recognized residential satisfaction.
The implementation of the consumer-customized residential policies, promoted by the government, requires the understanding of the inconsistency between the residential satisfaction and the physical residential environment as well as the policies to dissolve the inconsistency. In the present study, we identified the determinants of the inconsistency between the residential satisfaction and the physical residential environment, and suggested that the determinants of the inconsistency have heuristic characteristics. To overcome the limitation of the present study, which is the imbalance of the established data, more studies may need to be conducted by extending the subject regions in order to accumulate generalized data regarding the inconsistency and investigate the sociodemographic causes.
Acknowledgments
This study was supported by the Research Program (Grant No.: NRF-2020R1I1A1A01068335) through the National Research Foundation of Korea funded by the Korean government (Ministry of Education) and the National Transport Technology Development Program (Grant No.: 21CTAP-C163604-01) funded by the Ministry of Land, Infrastructure, and Transport in 2020.
References
-
Ahn, Y.J., 2019. “The Effect of Physical Environments in Neighborhood on Residential Satisfaction of Public Central Apartment Housings”, GRI Review, 21(1): 241-260.
안용진, 2019. “물리적 근린환경 특성이 공공임대주택 입주민의 주거환경 만족도에 미친 영향”, 「GRI 연구논총」, 21(1): 241-260. -
Asami, Y., 1999. “Housing, Living Environment, which Appears in the Housing, Land Statistics Survey and the Housing Demand Survey”, Jūtaku, 48(11): 14-17.
浅見泰司, 1999. “住宅·土地統計調査と住宅需要実態調査に表われる住宅·住環境”, 「住宅」, 48(11): 14-17. -
Asami, Y., 2001. “Living Environment Level Index, Urban Housing Sciences”, 33: 39-44.
浅見泰司, 2001. “住環境水準の指標”, 「都市住宅学」, 33: 39-44. -
Architecture & Urban Research Institute, 2019. Data on the Supply Status of Basic Living Infrastructure in the Region and Analysis Guide, Sejong:Ministry of Land, Infrastructure and Transport.
건축도시공간연구소, 2019. 「지역의 기초생활인프라 공급 현황 자료 및 분석 안내서」, 세종: 국토교통부. -
Bae, M.K. and Park, S.H., 2018. “A Study on the Urban Regional Characteristics Affecting the Satisfaction of Residential Environment”, Journal of The Residential Environment Institute of Korea, 16(2): 183-195.
[
https://doi.org/10.22313/reik.2018.16.2.183
]

배민경·박승훈, 2018. “주거환경만족도에 영향을 미치는 도시의 지역적 특성에 관한 연구: 주관적 인지환경과 객관적 실증환경 차이를 중심으로”, 「주거환경」, 16(2): 183-195. -
Beenackers, M.A., Foster, S., Kamphuis, C.B.M., Titze, S., Divitini, M.L., Knuiman, M., van Lenthe, F.J., and Giles-Corti, B., 2012. “Taking up Cycling after Residential Relocation: Built Environment Factors”, American Journal of Preventive Medicine, 42(6): 610-615.
[https://doi.org/10.1016/j.amepre.2012.02.021]
-
Chang, Y.B., Lee, J.A., and Kang, S.I., 2017. “A Study on the Distribution Characteristics of Indexes Representing the Level of Sharing City: Focused on Seoul, Gyeonggi, and Incheon Metropolitan in Korea”, Journal of Korea Planning Association, 52(3): 75-91.
[
https://doi.org/10.17208/jkpa.2017.06.52.3.75
]
장윤배·이주아·강성익, 2017. “공유도시 지표설정을 통한 공유도시 수준의 지역적 분포특성 분석: 수도권 지역을 중심으로”, 「국토계획」, 52(3): 75-91. -
Chen, L., Zhang, W., Yang, Y., and Yu, J., 2013. “Disparities in Residential Environment and Satisfaction among Urban Residents in Dalian, China”, Habitat International, 40: 100-108.
[https://doi.org/10.1016/j.habitatint.2013.03.002]
-
Cho, D.H., Shin, J.Y., Kim, K.Y., and Lee, G.H., 2010. “An Analysis of Spatial Accessibility to Public Healthcare Services in Rural Areas”, Journal of the Korea Association of Regional Geographers, 16(2): 137-153.
조대헌·신정엽·김감영·이건학, 2010. “농촌지역 공공 보건서비스에 대한 공간적 접근성 분석”, 「한국지역지리학회지」, 16(2): 137-153. -
Cho, M.J. and Lee, M.H., 2015. “Effects of Regional and Neighborhood Living Environment to the Prices of Aged Apartments”, Journal of Korea Planning Association, 50(4): 23-47.
[
https://doi.org/10.17208/jkpa.2015.06.50.4.23
]
조미정·이명훈, 2015. “근린생활환경이 노후 공동주택 가격에 미치는 영향 연구”, 「국토계획」, 50(4): 23-47. -
Choi, H.Y. and Jun, H.J., 2017. “The Relationship between Residential Mobility and Residential Satisfaction in the Seoul Metropolitan Area”, Journal of The Korean Urban Management Association, 30(1): 163-180.
[
https://doi.org/10.36700/KRUMA.2017.03.30.1.163
]
최희용·전희정, 2017. “수도권 거주가구의 주거이동방향 간 주거환경만족도 차이 분석”, 「도시행정학보」, 30(1): 163-180. -
Chun, H.J., 2016. “The Study of Comparison of Housing Price Models by Using Spatial Econometrics and GIS”, Korea Real Estate Academy Review, 64: 46-56.
전해정, 2016. “공간계량분석기법과 GIS를 이용한 주택가격 모형 비교에 관한 연구”, 「부동산학보」, 64: 46-56. -
Cohen, J., 1960. “A Coefficient of Agreement for Nominal Scales”, Educational and Psychological Measurement, 20(1): 37-46.
[https://doi.org/10.1177/001316446002000104]
-
Dill, J. and Voros, K., 2007. “Factors Affecting Bicycling Demand: Initial Survey Findings from the Portland, Oregon. Region”, Transportation Research Record: Journal of the Transportation Research Board, 2031(1): 9-17.
[https://doi.org/10.3141/2031-02]
-
Doh, S.G., Kim, E.J., and Lee, K.T., 2015. “A Study on the Relationship between Subway Station Areas and Apartment Price: Focusing on Apartment Price Fluctuation by the Construction of the Daegu Subway Line 3”, Korean Public Administration Quarterly, 27(2): 543-565.
도수관·김은지·이규태, 2015. “도시철도 역세권과 아파트 가격의 관계 분석: 대구도시철도 3호선 건설에 따른 아파트 가격 변동 및 가격결정요인을 중심으로”, 「한국행정논집」, 27(2): 543-565. -
Fisher, R.A., 1925. “Theory of Statistical Estimation”, In Mathematical Proceedings of the Cambridge Philosophical Society, 22(5): 700-725.
[https://doi.org/10.1017/S0305004100009580]
- Fotheringham, A.S., Brunsdon, C., and Charlton, M., 2002. Geographically Weighted Regression: The Analysis of Spatially Varying Relationships, Chichester: John Wiley & Sons.
-
Gebel, K., Bauman, A.E., Sugiyama, T., and Owen, N., 2011. “Mismatch between Perceived and Objectively Assessed Neighborhood Walkability Attributes: Prospective Relationships with Walking and Weight Gain”, Health & Place, 17(2): 519-524.
[https://doi.org/10.1016/j.healthplace.2010.12.008]
-
Hwang, K.S., 2013. “A Study on Residential Environment and Residential Satisfaction Based on Housing Tenure Type: Implications of Welfare for Housing Policy”, Seoul Studies, 14(1): 57-72.
황광선, 2013. “주택점유형태에 따른 주거환경과 주거만족 연구: 주택복지정책에 대한 함의”, 「서울도시연구」, 14(1): 57-72. -
Jang, C.Y. and Rho, T.U., 2015. “A Study on Determinants of Single Family Housing Price in Seoul: Based on the Real Transaction Price”, Appraisal Studies, 14(1): 55-71.
장충용·노태욱, 2015. “서울시 단독주택 가격결정요인에 관한 연구: 실거래 사례를 기반으로”, 「감정평가학논집」, 14(1): 55-71. -
Jang, H.D., 2008. “Factors Affecting Residential Satisfaction and Built Environment Evaluation by Using Them: Focused on Evaluation by Sub-groups Classified Residents’ Characteristics on Middle and Small Size Apartment in Seoul”, Journal of the Architectural Institute of Korea-Planning & Design, 24(5): 11-21.
장한두, 2008. “주거만족 영향요인과 주거환경평가: 서울시 중소규모 아파트의 거주자 특성별 분석을 중심으로”, 「대한건축학회 논문집–계획계」, 24(5): 11-21. -
Jeong, B.H. and Chung, J.H., 2015. “A Research on the Effect of Residential Property on Residential Satisfaction and Values”, Korea Real Estate Academy Review, 63: 256-267.
정병호·정재호, 2015. “주거특성이 주거만족도와 주거가치관에 미치는 영향에 관한 연구”, 「부동산학보」, 63: 256-267. -
Kang, C.D., 2021. “Effects of Intermodalism of Public Transit on Land Prices: Case of Metro and Bus Transit in Seoul, Korea”, Korea Real Estate Research Institute, 31(2): 47-68.
[
https://doi.org/10.35136/krer.31.2.4
]
강창덕, 2021. “대중교통 통합연계 서비스가 토지가격에 미치는 영향”, 「부동산연구」, 31(2): 47-68. -
Kang, S.J., Kim, C.S., and Nam, J., 2008. “Types, Locations and Characteristics of Residential Areas in Seoul”, Journal of Korea Planning Association, 43(3): 129-143.
강세진·김창석·남진, 2008. “블록별 주거환경지표의 군집분석을 통한 서울시주거지유형 및 유형별 특성분석”, 「국토계획」, 43(3): 129-143. -
Kang, S.J. and Seo, W.S., 2016. “Investigating Impacts of Subway Line and Station Features on Apartment Resale Prices”, The Korea Spatial Planning Review, 89: 149-162.
[
https://doi.org/10.15793/kspr.2016.89..009
]
강수진·서원석, 2016. “지하철 노선 및 역사특성이 아파트 매매가격에 미치는 영향 분석”, 「국토연구」, 89: 149-162. -
Kim, J.Y. and Park, N.H., 1997. “The Evaluation of the Residential Environmental Qualities in the New Town”, Journal of the Korean Housing Association, 8(3): 99-109.
김준영·박남희, 1997. “신도시 지역의 주거환경수준 평가에 관한 연구”, 「한국주거학회지」, 8(3): 99-109. -
Kim, K.D., 2018. “A Study on the Difference of Residential Preferences by Generation in Seoul’s Doksan-dong and Yeonnam-dong”, Master’s Dissertation, Seoul National University Graduate School.
김경동, 2018. “서울 독산동과 연남동의 세대별 거주환경 선호 차이에 대한 연구”, 서울대학교 대학원 석사학위논문. -
Kim, K.Y. and Ahn, J.K., 2010. “Determinant Factors for the Apartment Unit Prices of Large Scale Apartment Complexes over 1,000 Households in Seoul Metropolitan Area”, Journal of the Korean Housing Association, 21(6): 81-90.
[
https://doi.org/10.6107/JKHA.2010.21.6.081
]
김광영·안정근, 2010. “서울시 1,000세대 이상 대규모 아파트단지의 아파트가격 결정요인에 관한 연구”, 「한국주거학회논문집」, 21(6): 81-90. -
Kim, M.S., Song, K.J., Nam, C.M., and Jung, I.K., 2012. “A Study on Comparison of Generalized Kappa Statistics in Agreement Analysis”, The Korean Journal of Applied Statistics, 25(5): 719-731.
[https://doi.org/10.5351/KJAS.2012.25.5.719]
-
Kim, S.Y. and Park, C.I., 2012. “A Study on the Determinants of Resident Satisfaction in Public Rental Housing”, Social Science Research Review, 28(2): 79-99.
김선엽·박천일, 2012. “공공임대주택 거주자의 주거만족 결정 요인에 관한 연구”, 「사회과학연구」, 28(2): 79-99. -
Kim, T.H., Park, T.J., Son, S.H., and Park, J.J., 2015. “A Study on the Classification of Transportation Connections in Seoul Subway Adjacent Area Using Portfolio Analysis”, Journal of the Korean Society of Civil Engineers, 35(6): 1329-1338.
[
https://doi.org/10.12652/Ksce.2015.35.6.1329
]
김태호·박준태·손상호·박제진, 2015. “Portfolio 분석을 이용한 서울시 역세권 지하철 연계수단간 유형분류 연구: 서울시 25개 행정구역을 중심으로”, 「대한토목학회논문집」, 35(6): 1329-1338. -
Kim, T.K. and Lee, S.I., 2007. “An Analysis of Determinants of Residential Satisfaction by Regionaccording to Spatial Characteristic”, The Korea Spatial Planning Review, 53: 131-146.
[
https://doi.org/10.15793/kspr.2007.53..008
]
김태경·이승일, 2007. “공간특성에 따른 지역별 주거만족도 결정요인 분석”, 「국토연구」, 53: 131-146. -
Kwon, S.Y. and Park, H.Y., 2014. “Analysis on Affecting Factors for the Housing Environment Satisfaction of One-person Households in Seoul”, Housing Studies Review, 22(1): 77-104.
권세연·박환용, 2014. “서울시 1인 가구의 주거환경만족 영향요인 연구”, 「주택연구」, 22(1): 77-104. -
Landis, J.R. and Koch, G.G., 1977. “The Measurement of Observer Agreement for Categorical Data”, Biometrics, 33(1): 159-174.
[https://doi.org/10.2307/2529310]
-
Lee, J.H. and Koh, B.S., 2012. “A Study on the Determination Factor of Residential Satisfaction in the Apartment Houses –Focusing on Jeonbuk Area–”, Journal of The Residential Environment Institute of Korea, 10(3): 231-244.
이재현·고봉성, 2012. “공동주택 거주자의 주거만족도 결정 요인에 관한 연구 –전북지역을 중심으로–”, 「주거환경」, 10(3): 231-244. -
Lee, K.S., Kim, K.M., and Song, Y.N., 2010. “Impacts of Mixed-use Development and Transportation on Housing Value”, Journal of The Economic Geographical Society of Korea, 13(4): 515-528.
[
https://doi.org/10.23841/egsk.2010.13.4.515
]
이금숙·김경민·송예나, 2010. “복합용도개발과 교통이 아파트 가격에 미치는 영향”, 「한국경제지리학회」, 13(4): 515-528. -
Lee, K.W. and Sim, S.Y., 2016. “A Study on an Evaluation System by Factor Loadings”, Journal of the Korean Data and Information Science Society, 27(5): 1285-1291.
[
https://doi.org/10.7465/jkdi.2016.27.5.1285
]
이기원·심송용, 2016. “요인적재값 가중치를 사용한 평가 시스템에 대한 연구”, 「한국데이터정보과학회지」, 27(5): 1285-1291. -
Ma, L. and Dill, J., 2017. “Do People’s Perceptions of Neighborhood Bikeability Match “Reality”?”, Journal of Transport and Land Use, 10(1): 291-308.
[https://doi.org/10.5198/jtlu.2015.796]
-
MacCallum, R.C., Widaman, K.F., Preacher, K.J., and Hong, S. 2001. “Sample Size in Factor Analysis: The Role of Model Error”, Multivariate Behavioral Research, 36(4): 611-637.
[https://doi.org/10.1207/S15327906MBR3604_06]
-
McGinn, A.P., Evenson, K.R., Herring, A.H., Huston, S.L., and Rodriguez, D.A., 2007. “Exploring Associations between Physical Activity and Perceived and Objective Measures of the Built Environment”, Journal of urban health, 84: 162-184.
[https://doi.org/10.1007/s11524-006-9136-4]
-
McGinn, A.P., Evenson, K.R., Herring, A.H., Huston, S.L., and Rodriguez, D.A., 2008. “The Association of Perceived and Objectively Measured Crime with Physical Activity: A Cross-Sectional Analysis”, Journal of Physical Activity and Health, 5(1): 117-131.
[https://doi.org/10.1123/jpah.5.1.117]
-
Ministry of Land, Infrastructure, Transport and Tourism, 2007. “Indicator of Living Environment Level” Utilization Manual.
国土交通省住宅局, 2007. 「居住環境水準の指標」 活用マニュアル. -
Mohit, M.A., Ibrahim, M., and Rashid, Y.R., 2010. “Assessment of Residential Satisfaction in Newly Designed Public Low-cost Housing in Kuala Lumpur, Malaysia”, Habitat International, 34(1): 18-27.
[https://doi.org/10.1016/j.habitatint.2009.04.002]
-
Oh, K.S., Lee, W.K., and Jung,Y.W., 1996. “A GIS Approach Towards the Evaluation of the Quality of the Urban Residentail Environment and to Zoning for Management”, The Journal of GIS Association of Korea, 4(2): 121-130.
오규식·이왕기·정연우, 1996. “GIS를 이용한 도시주거환경의 평가 및 정비지구 유형화”, 「한국 GIS 학회지」, 4(2): 121-130. -
Park, J.H., Jung, T.S., and Sung, M.Y., 2009. “A Study on the Residential Environment Satisfaction of Apartment Complex”, Journal of Korea Real Estate Society, 27: 223-240.
박종오·정택승·성무용, 2009. “아파트 단지의 주거환경 만족도에 관한 연구”, 「대한부동산학회지」, 27: 223-240. -
Park, Y.H. and Lim, H.C., 2020. “A Comparative Study on the Determinants of Residential Satisfaction between Housing Vulnerable Groups and the Middle Class Households”, GRI Review, 22(1): 273-300.
박윤환·임현철, 2020. “주거취약계층과 중산층의 주거만족도 결정요인 비교 분석”, 「GRI 연구논총」, 22(1): 273-300. -
Parker, C., Mathews, B.P., 2001. “Customer Satisfaction: Contrasting Academic and Consumers’ Interpretations.” Marketing Intelligence & Planning. 19(1): 38-44.
[https://doi.org/10.1108/02634500110363790]
-
Perez, F.R., Fernandez, G.F.M., Rivera, E.P., and Abuin, J.M.R., 2001. “Ageing in Place: Predictors of the Residential Satisfaction of Elderly”, Social Indicators Research, 54: 173-208.
[https://doi.org/10.1023/A:1010852607362]
-
Prins, R.G., Oenema, A., van der Horst, K., and Brug, J., 2009. “Objective and Perceived Availability of Physical Activity Opportunities: Differences in Associations with Physical Activity Behavior Among Urban Adolescents”, the International Journal of Behavioral Nutrition and Physical Activity, 6: 1-9.
[https://doi.org/10.1186/1479-5868-6-70]
-
Scott, M.M., Evenson, K.R., Cohen, D.A., and Cox, C.E., 2007. “Comparing Perceived and Objectively Measured Access to Recreational Facilities as Predictors of Physical Activity in Adolescent Girls”, Journal of Urban Health, 84(3): 346-359.
[https://doi.org/10.1007/s11524-007-9179-1]
-
Shin, E.J. and Nam, J., 2012. “Determinants of Residential Satisfaction by Residential Environment of Apartment Complexes in Seoul”, Journal of Korea Planning Association, 47(5): 139-154.
신은진·남진, 2012. “서울시 아파트 단지의 주거환경 유형별 주거만족도 결정요인에 관한 연구”, 「국토계획」, 47(5): 139-154. -
Shin, S.Y., Lee, J.I., Lee, S.W., Kang, B.S., Kim, H.Y., Ahn, J.K., Lee, I.S., Cho, S.H., and Choi, J.M., 2008. Indicators and Evaluations of the Quality of Residential Environments in Seoul, Seoul Development Institute, 1-98.
신상영·이주일·이성원·강부성·김학열·안정근·이인성·조성학·최정민, 2008. 「서울시 주거환경의 질 지표와 평가에 관한 연구」, 서울시정개발연구원, 1-98. -
Shin, Y.C., Koo, J.H., and Kim, Y.K. 2011. “The Classification of Cities and Counties in Gyeonggi-Do based on Analysis of Effect and Cognition Characteristics on City Identity and City Brand–Focused on Analysis of External Cognition targeted on Experts and Seoul Citizens”, Journal of Korea Planning Association, 46(5): 5-18.
신예철·구자훈·김영걸, 2011. “도시정체성과 도시브랜드의영향관계 및 인지특성 분석에 따른 경기도 시군의 유형분류 연구–서울시민과 전문가를 대상으로 한 외부적 인지분석을 중심으로”, 「국토계획」, 46(5): 5-18. - Tabachnick, B.G. and Fidell, L.S., 2007. Using multivariate statistics (5th ed). NY: Pearson Education Inc.
-
Taniguchi, H. and Sadayuki, M., 1987. “Characteristics of Living Environment from the Viewpoint of Physical Conditions of High-rise Housing and Consciousness of Residents (mothers): Study on Living Space Planning for Infants in Urban Residential Areas”, Journal of Architecture, Planning and Environmental Engineering: Transactions of AIJ, 379: 39-49.
[
https://doi.org/10.3130/aijax.379.0_39
]
谷口汎邦·定行まり子, 1987. “高層住宅の物的条件と居住者(母親)の意識からみた居住環境の特性: 都市集合住宅地における幼児の生活空間計画に関する研究·その 1”, 「日本建築学会計画系論文報告集」, 379: 39-49. -
van Acker, V., Derudder, B., and Witlox, F., 2013. “Why People Use Their Cars while the Built Environment Imposes Cycling”, Journal of Transport and Land Use, 6(1): 53-62.
[https://doi.org/10.5198/jtlu.v6i1.288]
-
Yang, B.E., 1997. “Evaluation of Environmentally Friendliness of Housing Estates by Sustainability Indicators–In Case of Apartment Estates in Seoul Metropolitan Area”, Journal of Korea Planning Association, 32(2): 89-106.
양병이, 1997. “지속가능성 지표에 의한 우리나라 주거단지의 환경친화성 평가에 관한 연구–수도권 아파트 단지를 중심으로”, 「국토계획」, 32(2): 89-106. -
Yi, C.H. and Lee, S.I., 2010. “Analysis of Single Household Areas and Evaluation of Their Residential Environment in Seoul”, Seoul Studies, 11(2): 69-84.
이창효·이승일, 2010. “서울시 1인 가구의 밀집지역 분석과 주거환경 평가”, 「서울도시연구」, 11(2): 69-84. -
Yi, C.H., Kim, J.H., and Nam, J., 2009. “Analysis of Conformability between Evaluation of Residential Environment and Housing Price in Seoul”, Journal of Korea Planning Association, 44(3): 109-123.
이창효·김진하·남진, 2009. “서울시 주거환경의 평가와 주택가격과의 정합성 분석”, 「국토계획」, 44(3): 109-123. -
Yoo, S.E. and Yang, S.W., 2013. “Analysis on the Characteristics of the Residents Index and the Residental Satisfaction according to Zoning in the Urban Life’s Housing: With Special Emphasis on Gwanak-Gu Area, Seoul”, Journal of The Urban Design Insitute of Korea, 14(4): 83-92.
유시은·양승우, 2013. “용도지역에 따른 도시형생활주택의 거주자 특성과 주거만족도 분석: 서울 관악구 지역을 중심으로”, 「도시설계」, 14(4): 83-92. -
Yoon, H., 2009. “A Study on the Determinants of Residential Satisfaction of Permanent Rental Housing Tenants in Incheon”, Korea Real Estate Academy Review, 36: 343-365.
윤호, 2009. “인천시 영구임대주택 거주자의 주거만족도 영향요인 연구”, 「부동산학보」, 36: 343-365. -
Yoon, H., 2010. “A Study on the Residential Environment and Residential Satisfaction of Public Rent Housing Tenants in Incheon–Focused on Purchased Multi-Family Rental Housing and Permanent Rental Housing”, Korea Real Estate Academy Review, 41: 184-200.
윤호, 2010. “인천시 공공임대주택 거주자의 주거환경과 주거만족도에 관한 연구–다가구매입임대주택과 영구임대주택을 중심으로”, 「부동산학보」, 41: 184-200. -
Yoon, H.M. and Jung, S.Y., 2013. “The Effects Regional Characteristics of Housing Environment in Seoul upon Housing Price”, Journal of the Korea Real Estate Analysts Association, 19(4): 235-253.
윤효묵·정성용, 2013. “서울시의 지역주거환경 특성이 주택가격에 미치는 영향에 관한 연구”, 「부동산학연구」, 19(4): 235-253. -
Ministry of Land, Infrastructure and Transport, 2019, April 23. “2019 Comprehensive Housing plan”, https://www.molit.go.kr/USR/NEWS/m_71/dtl.jsp?lcmspage=106&id=95082188
국토교통부, 2019.4.23. “2019년 주거종합계획발표”, https://www.molit.go.kr/USR/NEWS/m_71/dtl.jsp?lcmspage=106&id=95082188 -
Ministry of Land, Infrastructure and Transport, 2020, May 23. “2020 Comprehensive Housing plan”, https://www.molit.go.kr/USR/NEWS/m_71/dtl.jsp?lcmspage=1&id=95083912
국토교통부, 2020.5.23. “2020년 주거종합계획발표”, https://www.molit.go.kr/USR/NEWS/m_71/dtl.jsp?lcmspage=1&id=95083912