Final publication date 22 Aug 2021
Development of Trip Generation and Trip Distribution Models for Car-sharing Considering Land Use and Transport Characteristics
Abstract
This study presents models for trip generation and distribution of car-sharing services based on So-car’s operation history data, GIS building integrated information, and public transportation information for 5 days during weekdays in Seoul metropolitan areas. Based on the trip generation model, the numbers of workers and students, total areas of commerce, business, education, and cultural facilities, as well as the density of subway stations showed positive (+) correlations, but the density of bus stops showed a negative (−) correlation. It was confirmed that the use rate of car sharing increased as accessibility to public transportation was lower in the case of outer areas of the city without subway stations. The adjusted R2 of the trip generation model for car-sharing was calculated as 0.587–0.637, thus confirming that the explanatory power of the model is high. By constructing the trip distribution model for car sharing by time zone based on the existing gravity model, the explanatory power of the model (adjusted R2) was calculated to be as high as 0.869–0.966, and the modified trip distribution model for car sharing reflected the generalization costs of taxi and public transportation. It was confirmed that as the generalization costs of taxis and public transportation increased, the utilization rate of car sharing increased.
Keywords:
Car Sharing, Trip Generation and Trip Distribution Models, Land use, Transport Characteristics, Generalized Cost키워드:
카셰어링, 통행발생 및 분포모형, 토지이용, 교통특성, 일반화비용Ⅰ. Introduction
Since the global economic crisis in 2008, the social and economic paradigm centered on mass production and consumption has shifted to a shared economy paradigm that seeks to maximize and streamline resource utilization. This paradigm shift is also active in urban transportation sectors, and, in particular, shared transport systems in the form of car-sharing, shared bicycles, personal mobility, and shared parking are spreading around the world along with the trend of environmentally friendly and sustainable development. Among these, car-sharing is the most representative form of shared transport systems, and its growth is evident both at home and abroad. In line with this trend, car-sharing services, such as Socar and Green Car, are operated mainly by private companies and local governments in Korea. According to the Open Government Data Portal, the number of vehicle units operated by car-sharing services in Seoul has doubled from 2,913 in 2015 to 6,814 in 2020, and the number of memberships of the services has grown exponentially by more than 3.5 times from about 900,000 in 2015 to 3.47 million as of 2019, making great strides. Some domestic and international studies have tried to figure out the expected outcomes of the growing car-sharing market, and the results indicate that passenger car traffic would decrease but demand for public transportation would rise with the growing usage of car-sharing services. Seoul city estimated that one car-sharing unit can replace 8.5 ordinary vehicle units, and that approximately 15,300 units of passenger cars can be reduced or forced to be reduced due to the car-sharing services.
The city also expected that this trend would make a positive impact in social, economic and environment sectors by saving more than KRW 28.9 billion of household expenses per year and reducing automobile greenhouse gas emissions by about 486 tons per year (The Seoul Institute, 2015). Despite the continued growth and positive potential of the car-sharing market, research on car-sharing in Korea has only been done focusing on rental stations and their neighborhood environment, with only limited research having been conducted on the travel behavior of the users. However, many overseas studies have been conducted thus far, centering on user surveys, car-sharing traffic history data analysis, and more.
The purpose of this study was to examine the preceding domestic and overseas studies, perform an empirical analysis based on the traffic history of car-sharing services, and to develop a car-sharing trip generation and trip distribution models that can be used by urban transportation designers/policy makers and car-sharing services operators going forward.
Ⅱ. Review of Existing Literature and Preceding Studies
1. Car sharing services
Shin and Bae (2012) derived the relation between total by-mode trip volume, ratio of by-purpose trips, ratio of car-sharing usage, frequency of use and car-sharing use demand for by-purpose trips & rental station site selection through regression analysis and stated preference analysis. Their study evaluated candidate sites for rental stations based on population density and accessibility and calculated the number of vehicles and parking spaces required for the demand at each candidate site. Do and Noh (2013) investigated the site allocation of the car-sharing rental stations to minimize the travel distances (cost). Based on population density, traffic volume, land value, the distance to the subway, railway and bus terminals, they derived a car-sharing site suitability index, and then suggested 30 car-sharing rental station sites with minimum travel costs utilizing the site allocation model. Choi and Park (2014) used the car-sharing usage data and GIS to establish the urban, regional, and socio-economic variables database related to the rental stations’ site characteristics, and derived latent variables through principal component analysis (PCA). They also analyzed the meaning of the influence variables on the characteristics of car-sharing usage through multiple regression analysis using factor scores. The results show that the level of usage of the car-sharing services was higher in the central business districts, station influence areas, and regions adjacent to universities, and in areas with better accessibility to public transport services, the frequency of car-sharing usage was found to increase. Park and Park (2015) conducted surveys on Green car and Socar users to analyze the relation between car-sharing and demand for taxis and found that the taxi users were mostly traveling short distances (40km or shorter) while car-sharing users travel longer distances (40km or longer), indicating that the two modes of trips only had a limited influence on each another. Kim and Lee (2016) used the rental history data and public transportation GIS DB for Green car operated by Suwon city to build and interpret the model of demand for the car-sharing rental stations based on the accessibility to public transportation. They found that the accessibility to public transportation of the rental stations was a significant variable in the use of car-sharing services, and that the easier it is to access to public transportation, the higher the demand for car-sharing can be achieved. Seo and Sheok (2017) conducted an analysis on the environmental factors that affect the use of car-sharing based on the history data of the current shared car rental stations, public transportation and land use, and found that it is necessary to consider locations where public transportation is actively used and the ratio of residential buildings is high when selecting a car-sharing rental station.
TRB (2005) suggested public transportation accessibility, favorable pedestrian environment, lower-than-average vehicle ownership, higher-than-average density and land use mix as the required conditions for car-sharing rental station sites. Cervero (2009) concluded that Transit Oriented Development (TOD) plays a key role in the use of car-sharing services and that car-sharing services and public transportation are complementary modes of travel. Celsor and Millard-Ball (2007) found that the local and traffic environment characteristics have a more significant impact on the use of car-sharing than personal characteristics. Based on the logistic regression analysis and duration model technique, Khan and Machemehl (2017) analyzed the land use variables that affect the demand for car-sharing, and found that car ownership, adult population, household size, and high household income are significant variables for using car-sharing services and that policies regarding car-sharing services and the number of stops for public transportation services also are major variables affecting the demand for car-sharing services. In a survey of 16 people at Bath, UK, Chatterjee (2013) analyzed the car-sharing use characteristics by car ownership and found that users can have more options in terms of cost and convenience by opting for car-sharing services over private vehicles, concluding that car-sharing services should be included in the urban transport model. Clewlow (2016) found that, based on the household travel survey in California, U.S., the number of vehicles owned by car-sharing users in densely populated urban areas was 0.58 units, while that of car-sharing users in suburban areas was 0.96 units, and that the number of trips by users in urban areas was higher than that of the surburban areas. Transportation Research and Education Center at Portland State University (2017) surveyed car-sharing users in Portland, Oregon (regardless of car ownership) and found that they were sensitive to accessibility to destinations and traveling hours. The study concluded that by using car-sharing services, walking, cycling, and the use of public transport increased while the use of private vehicles was reduced. Leclerc et al. (2013) analyzed the characteristics of three components—stop locations, trip properties, and trip chain— which consist of a trip of the members of station-based car-sharing services. They found that drivers of shared cars traveled longer within the trip chain than those driving their own cars, and these trips were relatively shorter and made often for non-business purposes (shopping or visiting, etc.). Car-sharing users were also likely to maximize the use of their vehicles during the period of their service, with 30% and 50% more trips being made during long distance travel and short distance travel, respectively. Sioui et al. (2013) found that the users’ mode of choice depended on whether a household owned a vehicle, since the service use frequency increased greatly for households without a car, while the households owning a car showed no significant changes in their mode of choice attributable to the availability of car-sharing services.
2. Trip generation and trip distribtiom model
With regards to trip generation models, the 2019 Korea Transport Database (MOLIT, KOTI, 2020) for Seoul Metropolitan Area (SMA), which is currently in use to estimate travel demand in Korea, conducted a regression analysis using the number of population, workers, students, and employees as dependent variables when predicting trip generation and arrival volume in each zone. Song et al. (2011) established a trip generation model using GIS-based land use variables in addition to a socio-economic index to improve the existing model. Jeon et al. (2017) used in/outbound accessibility — an inverse of the average travel time from an origin to each destination — as trip generation/attraction variables, suggesting that the trip generation model taking into account the accessibility factor was superior to the existing model. In many other domestic literature, the population, land use, transport accessibility, infrastructure density, and industrial and economic variables were used as variables in trip generation models.
Regarding a trip distribution model, a modified mixed gravity model was used in O/D construction for 2019 KTDB for SMA (MOLIT, KOTI, 2020). The parameters by purpose and distance were estimated using the average distances from public roads to public transportation as friction factors in the gravity model. Kim (2006) introduced a neural network model to draw up a modified gravity model which added the relative attractiveness variables between regions. As for the attractiveness variables, the relative size of employee group, the relative scale of aging, jobs-to-housing ratio, etc., were considered on the origin side, while the relative size of workers and jobs-to-housing ratio characteristics were taken into account at the destination side. Jeon and Rho (2015) derived a gravity model that employed new correction coefficients such as housing density, expressways and subway accessibility, given that the existing gravity model was not able to fully explain the relations between zones. Choi and Rho (2015) also defined a new gravity model with accessibility as a new variable, which was defined as the weighted mean value for the relative distance between zones and population size so that the trip characteristics between zones could be properly reflected. Jang, J.Y. (2019) used the space syntax technique to calculate the integration level of road links and defined a new friction factor in which the integration level serves as a variable. Jeon et al. (2017) further applied the in/outbound accessibility variable in the deterrence function of their gravity model, which can be presented as follows:
| (1) |
With regards to trip generation models, TRB (2007) calculated the purpose-specific trip generation volumes for each traffic zone based on population, number of households, number of workers, vehicle ownership, and household income as independant variables for traffic volume estimation. The Wisconsin DOT (2020) estimated the induced traffic and through traffic in the trip generation model. The induced traffic volume is estimated based on the trip generation rate through the traffic volume survey on major development areas, and land use (residence, business, hotel, and commercial facilities, etc.) is taken into account for new traffic-inducing areas.
In terms of traffic distribution models, FHWA (1997) employs a double-controlled gravity model to predict trip distribution; in areas with a well-organized public transportation system, a public transportation integrated network based generalization cost is used as a friction factor, while in areas with insufficient transport infrastructure, the shortest travel time between zones in a public road network is used. According to U.S. Department of Transportation(2011), the Florida DOT uses the actual generalized cost as a friction factor, considering travel time, extra time for public transport (time spent in terminals, etc), and toll charges (from toll roads and public transport charges). Mexico IMIP (Instituto municipal de investigaci ó n y planeacion) (1999) derived the inter-zone travel times of three modes of transport (passenger car, bus and walking) for non home-based (NHB) trips, and used the inter-zone travel times calculated with the mode choice ratio by zone as a friction factor.
| (2) |
According to the New Zealand Transport Agency(2012), the New Zealand Ministry of Transport does not consider the friction factor for public transportation, but it does employ a gravity model that uses public road-based generalized costs such as fuel costs, time value costs, and parking fees, as friction factors.
3. Implications
The literature review shows that studies involving car-sharing have centered on the local characteristics of the rental stations and its site selection strategies. These studies divided the characteristic variables of the use of car-sharing into land use factors and traffic factors, and suggest that the land use factors affect the travel pattern (trip purpose) or demand, while the traffic factors have an influence on the accessibility of car-sharing services. However, the preceding studies were not based on an analysis of the trip characteristics of actual car-sharing service users, but on the neighborhood characteristics of the existing rental stations of the car-sharing service. In addition, as many of the research was based on surveys rather than on actual traffic history data of car-sharing service users, there is a limitation in that the actual trip characteristics of the users were not properly reflected.
As for the trip generation models, domestic KTDB calculates trip generation based on population, number of workers, students and employees. In line with that, some studies have been conducted with an aim of improving the accuracy of their models by establishing trip generation models applying land use factors. In an effort to offset some of the limitations of the existing gravity model, a modified gravity model was presented in which new variables, such as attractiveness and accessibility, were introduced so that the trip-interchange characteristics between origins and destinations can be reflected. In addition, studies on a new gravity model are underway that reflect the public transport characteristics between zone pairs and the actual cost (generalized cost), rather than the conventional gravity model that utilizes the public road passage costs as a friction factor.
Today, demand for car-sharing is dramatically rising thanks to the increase in rental stations and the introduction of various price discount schemes and services, along with the growing trend of new forms of shared transport and public transport services such as shared bicycles, personal mobility, and demand responsive transport (DRT), etc. However, studies based on actual trip history data of shared transportation services and O/D land use and traffic characteristics are still insufficient. This study aims to analyze what impact would be made on the trip characteristics of car-sharing services by the O/D land use on the car-sharing service users’ side, traffic characteristics, and the environmental factors between trip zone pairs. To this end, this study first tried to build a car-sharing trip generation model and gravity model-based trip distribution mode by taking into account actual car-sharing traffic history data in SMA, land use, socio-economic index, and distribution of public transportation facilities. Furthermore, this study develops a model of trip distribution that reflects not only the environmental factors around the rental stations, but also the traffic characteristics between its O/D pairs. Ultimately, based on the results, this study aims to contribute to enhancing shared transportation services including personal mobility, shared bicycles and DRT.
Ⅲ. Building Car-sharing Trip Generation and Distribution Models
1. Methodology
The study was conducted in accordance with the following procedure to develop models of trip generation and distribution based on the analysis of trip characteristics of car-sharing users. First, the study analyzed the factors inducing demand for car-sharing trips based on 2018 car-sharing traffic history data in SMA, socio-economic index, and land use data. Among these, highly relevant variables were selected and applied in multiple regression analyses to build a trip generation model. Second, based on the history of car-sharing traffic, a car-sharing trip distribution model was established based on a gravity model commonly used in domestic studies, and another trip distribution model for O/D of other means of transport (passenger car, taxi, public transport) was built based on the 2019 SMA KTDB data (MOLIT, KOTI, 2020). Using these two models, the characteristics of different modes of transport were compared. Finally, to compensate for the limitations that the conventional trip distribution model cannot properly reflect the unique traffic characteristics of each zone pair, a modified car-sharing trip distribution model was established in consideration of the accessibility of transportation means (generalized cost of taxis and public transportation) between each zone pair and its adequacy was verified.
For this purpose, the traffic history data of Socar vehicles that drove in SMA for 5 weekdays from March 25 to March 29, 2018 were used. Socar and Green Car are both car-sharing services operating in SMA,, but only Socar's history data was used in this study. Green car vehicles are equipped with a ‘stop-and-go’ function, which collects all stop histories, including simple stops caused by traffic signals. This function makes it difficult to collect pure travel histories, so the Green car units were excluded from this study. It was built the traffic history data of Socar vehicle in form of GIS and it is shown in Figure 1. As an independent variable of the car-sharing trip generation model, socioeconomic indicators, such as the population, number of workers, number of students, and number of employees per administrative district (Dong) in SMA, 2018 were used, and land use indicators, such as the total floor area of buildings by use in 2018 provided by the GIS integrated building information in the Korea National Spatial Infrastructure Portal were used. To reflect the traffic characteristics of the origins and destinations, the density of bus stops and subway stations for each zone were also taken into account. The car-sharing trip distribution model was built on the history data presented earlier, and, on the basis of the 2019 SMA KTDB data (MOLIT, KOTI, 2020),1) the trip distribution model of other vehicles (passenger cars, taxis, public transportation O/D) was established and compared to the the car-sharing trip distribution suggested by this study. The origin-destination data subject to analysis was composed of a traffic zone system in 1,308 administrative districts (Dongs) provided by the 2019 SMA KTDB data (MOLIT, KOTI, 2020), and the traffic network also utilized public road and public transport (bus, subway, bus+subway) data from the same source.

So-car’s O/D distribution for 5 weekdays
Finally, the generalized costs of taxis and other means of public transport were calculated using the 2019 SMA KTDB data (MOLIT, KOTI, 2020) and a modified car-sharing trip distribution model was established. Since the gravity model tends to overestimate the amount of traffic inside a zone, and it is practically impossible to accurately calculate the travel time and cost of each means of transport within a zone from the 2019 SMA KTDB data (MOLIT, KOTI, 2020), this study only utilized the data of 24,539 trips excluding those of 3km or shorter.2)
2. Trip generation model
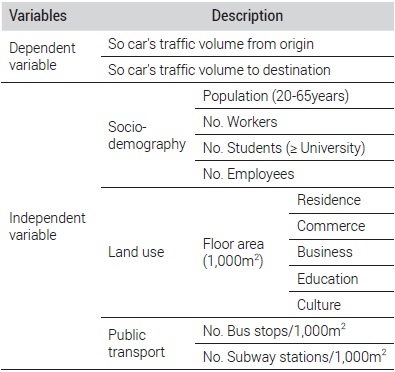
The preceding studies used the population, land use, transportation, infrastructure, and industrial and economic variables as the independent variables of the trip generation model. Based on these studies, this study selected the variables for its trip generation model like Table 1. The population, land use, and public transportation facilities data provided by each administrative district within SMA were set as independent variables for the car-sharing trip generation model, and multiple regression analyses were conducted.

Variables of trip generation models of So-car
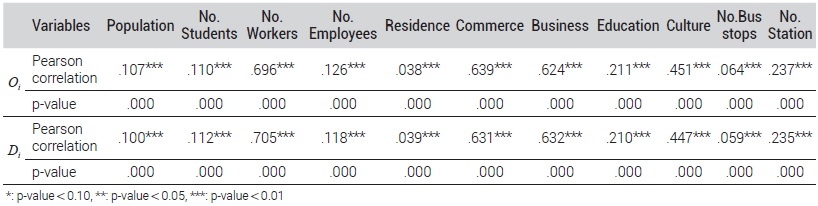
In order to analyze the characteristics of each time zone, the car-sharing trip generation model was separately constructed for all-day (0:00~24:00), the morning peak (07:00~09:00), and the afternoon peak (17:00~19:00). Table 2 shows the analysis result in the correlation between trip attraction volume and variables, it was found that all variables had a significant correlation with the trip attraction volume with a p-value of around 0.01. In particular, the Pearson correlation coefficient for the number of workers and commercial and business areas was 0.06 or higher.
Pearson correlation between variables and ridership of So-car
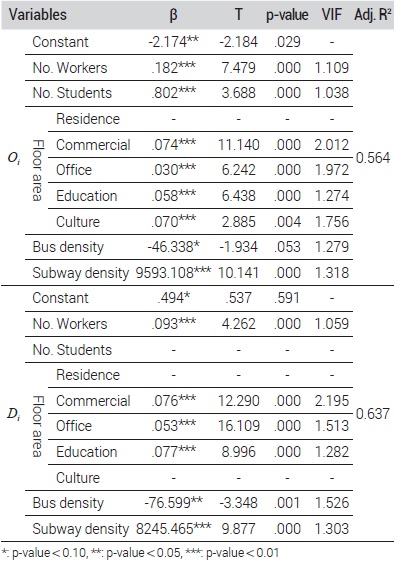
In addition, only variables with a p-value of less than 0.10 were selected for multiple regression analysis, and the Adjust-R2 of the trip generation model was estimated to be from 0.587 to 0.637. The existence of multicollinearity among the independent variables was checked by investigating the variance inflation factor (VIF), and the VIF was found to be from 1.0666 to 2.254, indicating no multicollinearity existing. The trip generation model established in this study is as follows:
| (3) |
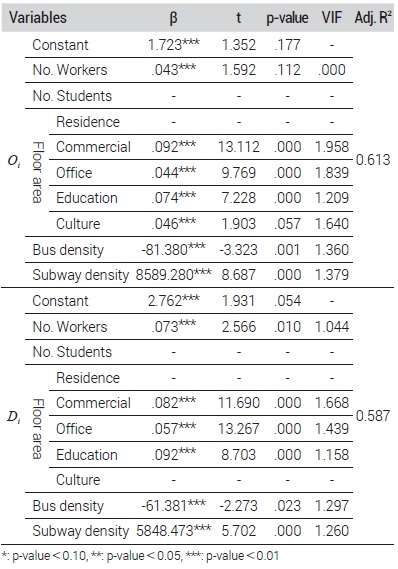
Table 3 is the trip generation model of So car for all day (0:00~24:00). A positive (+) correlation was observed with the variables such as the number of workers, students, gross floor areas of commercial, business, educational, cultural facilities, and subway station density, but it was found to be in negative (-) correlation with bus station density. As for the bus stops density and subway station density coefficients, these are not likely to have a significant impact in areas where bus stops and subway stations are similarly distributed, but in peripheral areas without subway stations, the use of car-sharing was found to increase when the bus stop density is low.
Trip generation model of So-car (Day: 0~24)
Table 4 is the trip generation model of So car for the morning peak (07:00~09:00). Unlike othe time zones, the gross floor area of residential facilities was selected as the independent variable of the trip outbound model, but that of business facilities was not selected. From this, it can be understood that car-sharing services are relatively active in residential areas (household-based) in the morning as compared to other time zones. The public transport variables tend to show similar trends as the model for all-day trip generation in general, but the coefficient of bus stop density was relatively higher, indicating that the inverse relation between bus stop density and car-sharing use in the morning becomes stronger. It is thought that car-sharing services are more actively used in the morning peak because the users are more pressed for time in the morning compared to other time zones.
Trip generation model of So-car (AM: 07~09)
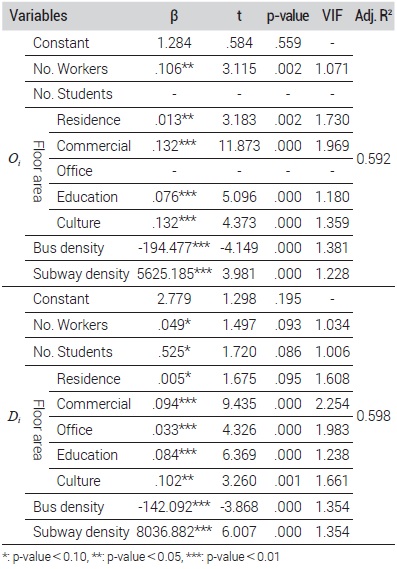
Table 5 is the trip generation model of So car for the afternoon peak(17:00~19:00). In the case, the trend was similar to the all day model, and this was related to the car-sharing service utilization rate by time zone. The analysis on the distribution of car-sharing service utilization by time zone showed that the utilization rate was relatively higher in the afternoon than in the morning. In addition, the car-sharing usage rates after 13:00 was observed to be around 6-7% of the daily capacity. The coefficients of commercial, educational, and business facilities were higher than the residential facilities, indicating that the trip purpose of the car-sharing users was not home-based, but for other purposes such as business or shopping.
Trip generation model of So-car (PM: 17~19)
3. Trip distribution model
The trip distribution models include the growth factor model (applying future growth factor to the trip distribution of the baseline year), uniform growth factor model, average factor model, Fratar model and gravity model (considering the volume of the trip generation and trip impendence between origins-destinations). Among those, the gravity model is the most commonly used trip distribution model. The deterrence function of the gravity model has three types: negative exponential function, inverse power function, and modified mixed type. Each coefficient of deterrence function (β, γ) represents the influence of the friction factor; the coefficient tends to be derived relatively small for essential trips and relatively large for non-essential trips.
Since the modified mixed type deterrence function is known to reflect the observed traffic pattern well in Korea, it is utilized to construct the SMA O/D database estimated by KTDB. This study used the modified mixed type gravity model used in the national transportation DB project as its trip distribution model for car-sharing. The trip deterrence function takes a form of a non-linear function whose parameters are difficult to calibrate, so it has been adjusted to facilitate parameter calibration by transforming both sides logarithmically and converting it to a linear model to calibrate :
| (4) |
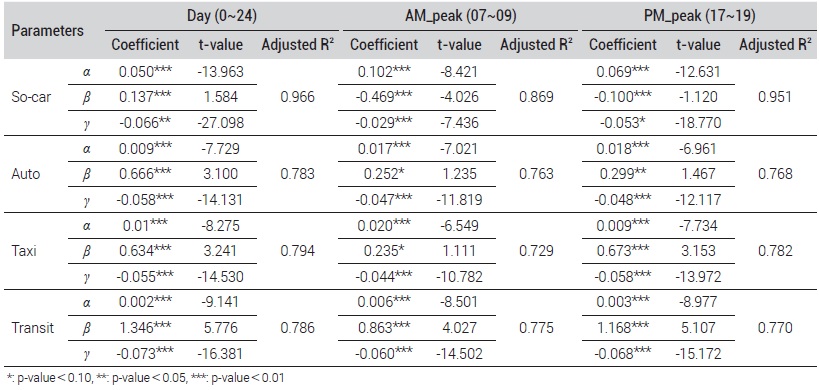
The car-sharing trip distribution model was separately constructed for all-day (0:00-24:00), the morning peak (07:00~09:00), and the afternoon peak (17:00-19:00), and the result is shown in Table 6. The results from the trip distribution modeling by time zone show that the explanatory power by the friction factor (Adjust-R2) was as high as 0.869 to 0.966. By time zone, the gradient of the morning peak distribution was gentler than that of the afternoon peak, with the slope of the all-day (0:00-24:00) being at the steepest. This seems to be attributable to a higher ratio of essential trips for business purpose (40km or longer) in the morning peak, and relatively higher ratio of non-business-related trips (less than 40km) such as leisure, social, and shopping purposes in the afternoon peak. Another reason that the slope of the all-day modeling (0:00-24:00) is at the steepest is that more people use Socar in off-peak hours than in the morning/afternoon peak times. As shown in Figure 2, this seems to be due to the fact that non-business trips (79%) and short-distance trips, which account for most Socar traffic, are concentrated on the off-peak hours.
Result of calibration for trip distribution model of So-car (Existing gravity model)

Hourly Traffic volume ratios of So-car
A trip distribution model was established based on the traffic volume data of passenger cars, taxis, and public transportation provided by the 2019 SMA KTDB data (MOLIT, KOTI, 2020) and such model was used in analyzing and comparing the trip distribution characteristics of car-sharing services. Figure 3 is the trip generation models of all modes and they show that the trip distribution ratio of car-sharing was higher than that of other means of transport in trips with less than 15km of travel distance. This is thought to be related to the trip characteristics of car-sharing service since the car-sharing services are used often for simple movement, leisure purpose trips, short-distance trips (to areas with limited availability of public transportation such as Hangang river park, etc.), and sporadic and continuous short-distance trips. On the other hand, the usage of car-sharing was relatively lower for travel distance of 20km or longer, which is attributed to the higher service rate of car-sharing in SMA than other means of transport.

Trip distribution of So-car by existing gravity model
In this study, a modified trip distribution model for car-sharing was established by considering the inter-zone traffic accessibility of taxis and public transportation, which was found to affect the trips of shared cars in the existing literature. To this end, this study suggests a modified car-sharing model by referring to the gravity model application methodology in which the generalized costs for each means of transportation used by the FHA in the U.S. was reflected:
| (5) |
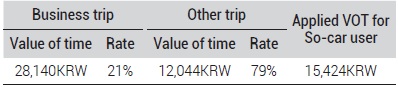
β, γ were derived from the existing trip distribution model presented earlier. As for the generalized cost of taxis and public transportation, the travel fares of taxis assigned and each means of public transportation by travel time and distance were applied based on the 2018 O/D and network data provided by the 2019 SMA KTDB data (MOLIT, KOTI, 2020). It should be noted that regarding public transport, the minimum value among ‘bus trips’, ‘subway trips’, and ‘bus+subway trips’ was applied as the generalized cost of public transport. For the travel value in generalized cost application, the travel time value, which is a weighted mean of the ratio of by-purpose trips (suggested by MOLIT, KOTI, 2014) and the travel time value of passenger cars by trip purpose (MOLIT, KOTI, 2020), was calculated for use like Table 7.
Value of time for user of So-car
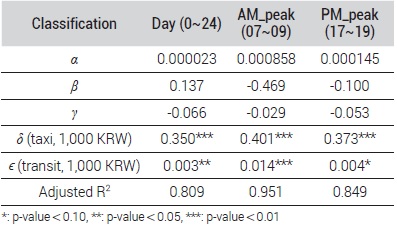
Table 8 shows the result of calibration for trip distribution of So-car. The factors of the modified car-sharing trip distribution were all statistically significant (p-value>0.10). The VIFs of all-day (0:00-24:00), morning peak (07:00-09:00) and afternoon peak (17:00-19:00) were 4.432, 5.216, and 4.199, respectively, confirming no existing multicollinearity. All adjust-R2 were calculated at 0.80 or higher, indicating that the model has excellent explanatory power and is well fit.
Result of calibration for trip distribution model of So-car (Modified Gravity Model)
As for the relationship between the distribution of car-sharing trips and taxi and public transportation by time zone, the sign of the coefficient for taxi and public transportation’s generalized costs was estimated to be positive (+), showing that the use of car-sharing services and generalized costs of taxis and public transportation has a positive correlation. To be more specific, it was found that as the generalized cost of taxis and public transportation between origins and destinations increases, the use of car-sharing will also increase, among which the generalized cost of taxis has a greater impact on the use of car-sharing services than that of public transportation.
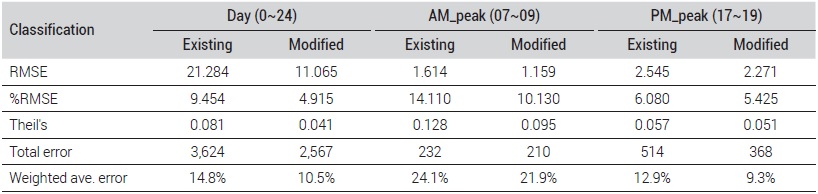
To verify the modified car-sharing trip distribution model reflecting generalized costs of taxis and public transportation, RMSE (root mean square error), % RMSE, Theil's inequality coefficient, weighted mean error rate, total error, etc. were utilized and the result is shown in Table 9.
Result of validation for trip distribution model of So-car
The results show that the weighted mean error rate, RMSE, and total error of the modified model were lower than the that of the existing model. Regarding the weighted mean error rate, the error of the existing model was 14.8%, while that of the modified model was 10.5%. In more detail, the weighted mean error rate of the morning peak by the existing model was 24.1%, while that of the modified model was 21.9%. As for the afternoon peak, the weighted mean error rate by the existing model was 12.9%, and that of the modified model was 9.3%. As shown in Figure 4, 5 and 6, in all time zones the modified model suggested by this study, which considered the generalized costs of taxis and public transportation, was found to be improved as compared to the conventional model.

Result of validation for trip distribution model of So-car (Day, 0~24)

Result of validation for trip distribution model of So-car (AM, 07~09)

Result of validation for trip distribution model of So-car (PM, 07~09)
Ⅳ. Conclusion and Tasks Ahead
1. Conclusion
With the growing use of new shared and public transport services such as personal mobility, shared bicycles, and DRT as well as car-sharing, the analysis on trip patterns of users is crucial in future service supply and operation. Thus far, domestic studies were mostly on the surrounding environment or relocation of car-sharing rental stations, with only limited research focusing on the actual traffic behavior of the users and the O/D trip characteristics. The purpose of this study was to perform an empirical analysis based on the driving histories of shared car trips, to build trip generation and distribution models for car-sharing.
For this purpose, this study established trip generation and distribution models of the car-sharing system using the method currently applied in Korea based on 5 weekdays of driving history data of Socar vehicles in SMA, integrated GIS building information, and public transportation facility information. In addition, a traffic distribution model for each means of transport was established based on the O/D of passenger cars, taxis, and public transportation provided by the 2019 SMA KTDB data (MOLIT, KOTI, 2020), and such model was comparatively analyzed with the trip distribution model for car-sharing suggested by this study. Finally, in order to reflect the unique characteristics of each origin-destination pair, a modified trip distribution model for car-sharing was built and verified, employing the generalized cost of taxis and public transportation as independent variables.
The trip generation modeling of Socar showed that the Adjust-R2 was found to be within the range of 0.587 and 0.637 for all-day (0:00-24:00), the morning peak (07:00-09:00), and the afternoon peak (17:00-19:00). A positive (+) correlation was observed with the variables such as the number of workers, students, gross floor areas of commercial, business, educational, cultural facilities, and subway station density, but it was found to be in a negative (-) correlation with bus stop density. It was found that in the case of suburban areas without subway stations, the lower the density of bus stops, (that is, the lower the accessibility to public transportation), the higher the rate of car-sharing usage, though it was not relevant in urban areas where subway and bus stops are densely distributed in the area.
Trip generation modeling of Socar with the conventional method showed that the explanatory power by travel distance (Adjust-R2) for all-day (0:00-24:00), the morning peak (07:00-09:00), and the afternoon peak (17:00-19:00) was found to be within the range of 0.869 and 0.966. Compared with the trip distribution model of other means of transport, it was found that the trip ratio of less than 15km was higher for car-sharing than other means. This is probably because the users mainly use car-sharing services when traveling in areas where access to public transportation is difficult, or simple moving, sporadic and continuous trips are necessary, to take the greatest advantage of their service reservation. This coincides with the results of Leclerc, B., Trépanier, M., & Morency, C. (2013) who argued that users of car-sharing services make more trips within the trip chain, and these trips tend to be relatively shorter and often for non-business purposes (such as shopping or visiting places), and that car-sharing users also tend to maximize the use of the vehicle during their period of use.
For travel distance of 20km or longer, the ratio of car-sharing trips was relatively lower compared to other means, which is attributable to the higher service rate of car-sharing in SMA than other means of transport. Given this, an integrated system connecting car-sharing service and public transport in areas with poor availability of public transportation or for long-distance trips is expected to reduce the generalized costs borne by the users while boosting demand for public transportation as well as car-sharing services. This echoes the results of Kim, S.H. and Lee, K.J., (2016) and Cervero (2009), suggesting accessibility to public transport is a significant variable in the use of car-sharing service, and car-sharing service and public transport are complementary in nature. As for the modified car-sharing trip distribution model, the sign of the coefficient for taxi and public transportation’s generalized costs was estimated to be positive (+), showing that the use of car-sharing services and generalized costs of taxis and public transportation is positively correlated. In other words, it was found that as the generalized cost of taxis and public transportation between origins and destinations increases, the probability of car-sharing service usage will also increase, and that the generalized cost of taxis has a greater impact on the use of car-sharing services than that of public transportation. Finally, RMSE, % RMSE, Theil's inequality coefficient, weighted mean error rate, and total error were used to verify the modified car-sharing trip distribution model and in all verification values, the model reflecting the generalized cost of taxis and public transportation showed lower errors than the existing model, confirming that the estimating power and reliability of the modified model showed improvement.
2. Tasks ahead
In this study, trip generation and distribution models for car-sharing were developed in consideration of O/D land use, socioeconomic indicators, public transport density, and generalized costs of taxis and buses between O/D pairs; however, there are some limitations. First, the study was limited in that only Socar trip history data was used in the analysis among other car-sharing services. Although Socar is the leading business in the car-sharing market with the top market share, it cannot be said for sure that Socar bona-fide represents the entire car-sharing service market. To make up for these limitations going forward, another model based on driving history data of other car-sharing services, such as Green Car or Deliverycar, should be established. Second, there is an issue found in the trip distribution model that it is difficult to estimate the distribution of intra-zone trips, which were made possible by using the existing gravity model. To tackle this issue, research that can reflect intrazone trips of 3km or shorter should also be conducted supported by traffic zones and network segmentation. Third, although relevant studies suggest that the regional and traffic environment characteristics are more influential than the personal characteristics of the car-sharing service users, the characteristics of the user were found to be a significant variable, therefore should be considered in future studies as well.
Currently, we are witnessing a significant increase in car-sharing users along with an outstanding growth in related industries and infrastructure. Given this, many preceding studies abroad have suggested that the car-sharing services should be included in urban transportation models. In this respect, it seems to be necessary to build a car-sharing demand model suitable for domestic situations by supplementing the limitations of this study. If the limitations of this study are improved and a high-quality car-sharing transportation model is established thanks to ardent research in the future, it would be well utilized by urban transportation planners and car-sharing operators. Going forward, such models will also be applied to the forecasting of transportation demand for new shared mobility and public transportation such as car-sharing, personal mobility, shared bicycles, and DRT.
Acknowledgments
This work was supported by 2019 Hongik University Research Fund.
References
-
Celsor, C. and Millard-Ball, A., 2007. “Where Does Carsharing Work?: Using Geographic Information Systems to Assess Market Potential”, Journal of the Transportation Research Board, 1992: 61-69.
[https://doi.org/10.3141/1992-08]

- Cervero, R., 2009. “TOD and Carsharing A Natural Marriage”, ACCESS Magazine, 1(35): 25-29.
-
Chatterjee, K., Andrews, G., Ricci, M., and Parkhurst, G., 2013. “Qualitative Insights into the Effect on Travel Behavior of Joining a Carshare”, Journal of the Transportation Research Board, 2359(1): 76-84.
[https://doi.org/10.3141/2359-10]
-
Choi, H.S. and Park. J.T., 2014. “Study on the Local Factors Affecting Availability of Car-Sharing in Seoul”, Journal of Korean Society for Railway, 17(5): 381-389.
최현수·박준태, 2014. “서울시의 카셰어링 이용도에 대한 지역적 요인특성분석”, 「한국철도학회논문집」, 17(5): 381-389. [ https://doi.org/10.7782/JKSR.2014.17.5.381 ]
-
Choi, S.T. and Rho, J.H., 2015. “Development and Implementation of a 2-Phase Calibration Method for Gravity Model Considering Accessibility”, Journal of Korean Society of Transportation, 33(4): 393-404.
최성택·노정현, 2015. “접근성 지표를 도입한 중력모형의 2단계 정산기법 개발 및 적용”, 「한국교통학회지」, 33(4): 393-404. [ https://doi.org/10.7470/jkst.2015.33.4.393 ]
-
Clewlow, R.R., 2016. “Carsharing and Sustainable Travel Behavior: Results from the San Francisco Bay Area”, Transport Policy, 51: 158-164.
[https://doi.org/10.1016/j.tranpol.2016.01.013]
-
Do, M.S. and Noh. Y.S., 2013. “Site Selection of Car-sharing Service by Spatial Analysis Method”, Journal of Korea a Institute of Intelligent Transport Systems, 12(6): 22-28.
도명식·노윤승, 2013. “공간분석기법을 이용한 Car-sharing 서비스 위치 선정”, 「한국ITS논문집」, 12(6): 22-28. [ https://doi.org/10.12815/kits.2013.12.6.022 ]
- FHWA(Federal Highway Administration), 1997. Travel Model Validation and Reasonableness Checking Manual(Travel Model Improvement Program), Cambridge Systematics, Inc, Massachusetts.
- Instituto Municipal de Investigación y planeacion, 1999. Estudio Integral de Transporte(Ⅲ)/Multimodal Transportation Study: Development of Travel Demand and Mobile Source Emissions Models for Base Year 1996, Juarez.
-
Jang, J.Y., 2019. “A Study on Improvement of Gravity model Decay Function of Transporting Demand Forecasting Considering Space Syntax”, Journal of the Korea Academia-Industrial cooperation Society, 20(3): 617-631.
장진영, 2019. “Space Syntax를 이용한 교통수요예측의 중력모형 저항함수의 개선방안”, 「한국산학기술학회논문지」, 20(3): 617-631. -
Jeon, Y.H. and Rho, J.H., 2015. “Estimation of Adjustment Coefficients to Improve Accuracy of Predictions of Inter-zonal Trips”, Journal of Korea Planning Association, 50(7): 131-140.
전용현·노정현, 2015. “존 간 교차통행량 예측치에 대한 보정 계수 추정”, 「국토계획」, 50(7): 131-140. [ https://doi.org/10.17208/jkpa.2015.11.50.7.131 ]
-
Jeon, Y.H., Rho, J.H., and Jang, J.S., 2017. “Development of Estimation Model of Trip Generation Model and Trip Distribution Model Reflecting Coefficient of Accessibility”, Journal of the Korea Academia-Industrial Cooperation Society, 18(6): 576-584.
전용현·노정현·장준석, 2017. “접근성 변수를 반영한 통행발생 및 통행분포모형 개발”, 「한국산학기술학회논문지」, 18(6): 576-584. -
Khan, M. and Machemehl, R., 2017. “The Impact of Land- Use Variables on Free-Floating Carsharing Vehicle Rental Choice and Parking Duration”, Seeing Cities Trough Big Data, Springer International Publishing, 331-347, Accessed February 28, 2021.
[https://doi.org/10.1007/978-3-319-40902-3_19]
-
Kim, S.H. and Lee, K.J., 2016. “The Impact of Public Transit Accessibility on the Car-sharing Use Demand”, Journal of Korea a Institute of Intelligent Transport Systems, 15(4) :1-11.
김숙희·이규진, 2016. “대중교통 접근성이 카셰어링 이용수요에 미치는 영향”, 「한국ITS논문집」, 15(4): 1-11. [ https://doi.org/10.12815/kits.2016.15.4.001 ]
-
Kim, T.G, 2006. “Development of a Trip Distribution Model Introducing Interzonal Relative Attractiveness”, Ph. D. Dissertation, Hanyang University.
김태균, 2006. “도시내 지역간 상대적 유인력 변수를 도입한 통행 분포모형 개발”, 한양대학교 대학원 박사학위논문. -
Leclerc, B., Trépanier, M., and Morency, C., 2013. “Unraveling the Travel Behavior of Carsharing Members from Global Positioning System Traces”, Journal of the Transportation Research Board, 2359(1): 59-67.
[https://doi.org/10.3141/2359-08]
-
Ministry of land, Infrastructure and Transport and The Korea Transport Institute, 2014. Study on the Effect of Car-sharing on Traffic Demand, Se-jong.
국토교통부·한국교통연구원, 2014. 「승용차 공동이용(카셰어링)이 교통수요에 미치는 영향 연구」, 세종. -
Ministry of land, Infrastructure and Transport and The Korea Transport Institute, 2020. The 2019 National Transportation Demand Survey & the Operation and Maintenance of Transportation DB system, Se-jong.
국토교통부·한국교통연구원, 2020. 「2019년 국가교통조사·DB 시스템 운영 및 유지보수 : 전국 여객 O/D보완 경신」, 세종. - NZ Transport Agency, 2012. NZ Transport Agency research report 473: Calibration of Trip Distribution by Generalised Linear Models, NZ Transport agency research, Wellington.
-
Park, J.S. and Park, J.H., 2015. “Impact of the Carsharing Service on Transport Demand and Taxi Service”, Journal of Transport Research, 22(2): 19-34.
박준식·박지홍, 2015. “카셰어링 서비스가 교통수요와 택시에 미치는 영향”, 「교통연구」, 22(2): 19-34. [ https://doi.org/10.34143/jtr.2015.22.2.19 ]
-
Seo, J.M. and Sheok, J.S., 2017. “A Study on Optimizing Depot Location in Carsharing Considering the Neighborhood Environmental Factors”, Journal of Korea a Institute of Intelligent Transport Systems, 16(5): 49-59.
서지민·석종수, 2017. “근린환경 요인을 고려한 카셰어링 대여소 배치 방안 연구”, 「한국ITS논문집」, 16(5): 49-59. [ https://doi.org/10.12815/kits.2017.16.5.49 ]
-
Shin, M.S. and Bae, S.H., 2012. “Study on Location Decisions for Cloud Transportation System Rental Station”, Journal of Korean Society of Transportation, 30(2): 29-42.
신민성·배상훈, 2012. “이동수요 대응형 클라우드 교통시스템 공유차량 대여소 입지선정”, 「한국교통학회지」, 30(2): 29-42. [ https://doi.org/10.7470/jkst.2012.30.2.029 ]
-
Sioui, L., Morency, C., and Trépanier, M., 2013. “How Carsharing Affects the Travel Behavior of Households: A Case Study of Montréal, Canada”, International Journal of Sustainable Transportation, 7(1): 52-69.
[https://doi.org/10.1080/15568318.2012.660109]
-
Song, J.I., Na, S.W., and Choo, S.H., 2011, “Developing Trip Generation Models Considering Land Use Characteristics”, Journal of Korea a Institute of Intelligent Transport Systems, 10(6): 126-139.
송재인·나승원·추상호, 2011. “토지이용 특성을 반영한 통행발 생모형 추정 연구”, 「한국ITS논문집」, 10(6):126-139. -
The Seoul Institute, 2015. Representative Project of Sharing Seoul, Car Sharing’s effect and Operation Plan, Seoul.
서울연구원, 2015. 「공유도시 상징사업 나눔카 효과평가 와 서비스의 운영방안」, 서울. - Transportation Research and Education Center at Portland State University, 2017. Final Report : Peer-to-Peer Carsharing: Short-Term Effects on Travel Behavior in Portland, TREC-RR-1144, Portland.
- Transportation Research Board, 2005. Car-sharing: Where and How It Succeeds, Washington D.C.
- Transportation Research Board, 2007. Metropolitan Travel Forecasting: Current Practice and Future Direction, Special report 288, Washington, D.C.
- U.S. Department of Transportation, 2011. Renaissance planning group, 2035 long range transportation plan, Appendix E: FDOT model calibration & validation results, Washington, D.C.
- Wisconsin Department of Transportation, 2020. Transportation Planning Manual, Wisconsin.