Final publication date 03 Mar 2021
An Empirical Study on Inundation Vulnerability in Urban Declining Areas through Analysis of Sales Change in Living Businesses : Focused on Ulsan Metropolitan City
Abstract
According to the IPCC 5th Assessment Report on climate change, climate change is expected to have a more serious impact on the vulnerable class, who are socially and economically unequal. Particularly, declining areas, which are considered to be the residential areas of the vulnerable class, are more easily influenced by typhoons and heavy rains owing to the old physical and economical environment. Nevertheless, existing urban regeneration areas are insufficient for a plan or policy that considers disaster responses. The purpose of this study is to reveal the vulnerability of declining areas damaged by Typhoon Chaba using sales change data in the region and to suggest the necessity of urban regeneration in response to the inundation vulnerability of the declining areas. The study area was Ulsan, South Korea, which was seriously damaged by Typhoon Chaba on October 5, 2016, and the spatial analysis unit was the census output area. We selected 51 declining areas designated as the districts of the urban regeneration plan and urban regeneration new deal areas in the urbanization area. We used a multiple regression model to analyze whether declining areas were more influenced by inundation damages than a general area using sales change data. The results indicated that the declining areas had more sensitive variables than the general areas and suffered more damages from inundation. In addition, this study revealed that the inundated depth was a major factor that influenced sales change in the region. In conclusion, this study indicated the requirement for an empirical study on inundation vulnerability and for suggesting the necessity of a disaster response in the existing urban regeneration plan.
Keywords:
Urban Declining Area, Inundated Area, Sales change, Typhoon Chaba, Multiple Regression Model키워드:
도시쇠퇴지역, 침수지역, 매출액 변화, 태풍 차바, 다중회귀분석Ⅰ. Introduction
1. Background and Purpose of the Study
Climate change, when combined with modern cities, increases occurrences of natural disasters such as extreme heat, drought, and floods. The irregular nature and scale of disasters that vary depending on physical and social characteristics of an urban space inflict serious losses of life and socioeconomic damage in different areas. The IPCC 5th Assessment Report on Climate Change projected that climate change, which has become increasingly severe recently, will have serious impacts on human beings and, in particular, those who are vulnerable to climate will suffer even bigger damage. As such, people who are marginalized due to social, economic and institutional inequalities are considered especially vulnerable to the effects of climate change, and the report emphasized the need for policy-oriented responses for vulnerable social groups.
Such damage is more likely to occur in urban communities experiencing decline due to deterioration of buildings, dwindling sales in commercial districts, and depopulation. Declining areas with deteriorated dwelling conditions and reduced economic activities are often considered for residence by vulnerable social groups. Due to this reason, local governments are endeavoring to re-vitalize their respective regions by carrying out public projects to create jobs and to improve residential environment under the Special Act on Promotion of and Support for Urban Regeneration (2013). As part of this effort, urban regeneration new deal projects are being implemented to revive depressed city centers across the nation. However, urban regeneration projects, launched as a way to improve declining areas economically, socially and culturally, seriously lack systems and policies that take disaster response into consideration1) (Yu, S.C. and Yeo, K.H., 2015).
Meanwhile, storms and floods account for over 90% of disasters that occur in Korea (Lee, M.W. et al., 2013). It is also emphasized that declining economic and physical characteristics raise inundation vulnerability (Lee, M.J. and Kang, J.E., 2012). As such, urban declining areas have distinctively different characteristics in terms of the status of infrastructure including population, building characteristics, land use, etc., which require responses in consideration of the spatial scale of a declining area (Park, J.K., 2016). In addition, while it has been reported that declining areas are vulnerable to inundation, most studies lack empirical analysis of actual occurrences of inundation and the level of damage. Moreover, studies on inundation damage focused on estimating direct damage on buildings and infrastructure (Lee, G.S. and Park, J.H., 2011). Estimating damage this way has limitations as it deals with data that can be collected only after a significant period of time has passed from the disaster, and thus it is difficult to promptly identify damage at the regional level.
Therefore, this study aims to demonstrate that declining areas are more vulnerable to inundation by using sales data from Ulsan Metropolitan City which suffered severe damage from typhoon Chaba on October 5, 2016. Unlike existing data on damage to buildings, sales data allow immediate identification of time series changes caused by inundation. To that end, this study will identify a correlation between declining areas and factors of inundation vulnerability, and demonstrate inundation vulnerability of declining areas from changes in sales in the aftermath of a typhoon and the resulting inundation.
Ⅱ. Literature Review
1. Areas vulnerable to Inundations and Declining Areas
An area vulnerable to inundation is defined as an area of high flood vulnerability2) (Kim, C. et al., 2003). In Korea, research on evaluating flood vulnerability caused by climate change has mainly dealt with spatial analysis units of shi (cities), gun (counties), gu (districts), or river basins (Kim, H.S. et al, 2012; Lee, B.J., et al, 2018; Lee, J.S. and Choi, H.I., 2018). However, information offered by such analysis is limited because the spatial range is wide. Moreover, inundation damage in urban areas due to localized heavy rains is increasing sharply, which shows a different tendency from damage caused by river inundation (Shin, S.Y. and Park, C.Y., 2014; Kang, H.W., 2015). To respond to and manage such phenomena, more detailed analysis was required for areas vulnerable to inundation.
Some studies have evaluated flood vulnerability for eup, myeon, and dong units of a particular city to determine relatively wide-range vulnerable areas and limited vulnerable areas (Son, M.S. et al., 2013; Kim, M.J. and Kim, G.S., 2018). Furthermore, the existing spatial analysis unit has a shortcoming of over-estimating vulnerable areas, and thus application of specific urban planning measures is limited. As such, Lee, S.H. and Kang, J.E. (2018) analyzed inundation vulnerability with the unit of census output area and suggested the necessity of a spatial analysis unit for specific application of urban planning. To that end, for areas vulnerable to inundation in communities, physical vulnerability factors such as detached housing, underground levels, and houses older than 20 years, and inundation trace maps3) of areas where actual damage occurred were considered in addition to flood vulnerability indicators. Consequently, it was found that frequent inundation damage is closely related to the level of growth and decline of a city, and geographical locations such as an old downtown or a deteriorating, physically declining area are important determinants (Hallstrom and Smith, 2005; Myers et al. 2008; Saldana-Zorrilla and Sandberg, 2009). In other words, the phenomenon of urban decline in the form of deteriorated housing, vacant houses, reduced sales, and paralysis of commercial functions seems to have affected disaster management (Rheem, S.K. and Lee, C.G, 2013).
Because a declining area is often a very vulnerable space within a city, in which deteriorated housing and commercial/business facilities are densely situated, it suffers relatively greater damage from disasters and its energy inefficiency is severe (Wang, G.I. et al., 2014). As such, inundation damage may frequently occur in areas where vulnerable social groups are living closely together. Social vulnerability factors have been considered in conjunction with physical characteristics to deduce vulnerability to disasters (Cutter, 1996). Social vulnerability factors include social, economic, and demographic characteristics that affect sensitivity and adaptive capacity, and thus, they have been considered as major factors for formulating disaster prevention measures (Park, H.N. and Song, J.M, 2014; Lee, K.M. et al., 2016).
As such, a few studies of late have carried out empirical research through correlations between actual flooded areas and vulnerable social groups. Park, J.K. (2016) demonstrated that, among urban communities that suffered inundation damage, areas of high disaster vulnerability had a relatively higher ratio of low-income residents. Seo, J.S. and Han, W.S. (2019) examined the spatial correlation between areas vulnerable to inundation and vulnerability factors, and discovered that, in urban areas, a population group of over 65 years of age was sensitive to inundation damage, and as for physical characteristics, inundation damage was related to the ratios of deteriorated detached housing and of semi underground housing units. Based on these findings, the study emphasized the need for investigating the distribution of such areas and for devising response measures in terms of urban planning for areas where vulnerable social groups are concentrated.
2. Inundation Vulnerability and Impact on Local Economy
Conceptually, vulnerability works as a factor that raises the scale of damage and the likelihood of its occurrence under the same conditions, but disaster damage data are used as indicators to validate vulnerability assessment results. Studies that aimed to predict damage from storms and floods involved analysis using casualties or frequency of occurrence, or used the actual amount of damage on buildings and infrastructure, etc. In its process of urbanization, Korea has seen an upward trend in the amount of flood damage (Jung, J.C. et al., 2007). Furthermore, other studies used the amount of damage from urban flooding for correlation and factor analysis, and suggested urban flooding risk factors - rain being the inducing factor, demographic and social factors, as well as economic factors as weighting factors, and the inundation area as the damaging factor (Kim, B.K. et al., 2011; Park, D.H. et al., 2011; Park, C.Y. et al., 2013; Lee, M.W. et al., 2013).
Causes of inundation damage make the severity of damage by each region vary depending on the regional conditions and factors of damage causes. Jang, O.J. and Kim, Y.O. (2009) performed non-linear regression analysis between flood damage amount and precipitation amount, and discovered that areas within shi, gun, and gu that have a lower ratio of vulnerable social groups and high financial capabilities had a low level of damage. Sim, J.S. et al. (2014) used a geographically weighted regression model on the amount of inundation damage to reveal that natural and artificial risk factors aggravated damage depending on the areas of inundation damage. Outside Korea, houses that belong to areas vulnerable to inundation are priced lower than those that do not, and when actual inundation occurs, their prices tend to plummet temporarily (Samarasinghe and Sharp, 2010; Atreya et al., 2013).
Inundation inflicts not only direct but also indirect damage on the local economy. Considering the importance of the commercial sector in terms of providing products, services and employment in a city, damage to commercial buildings due to inundation and resulting business interruption indirectly causes decreases in sales amount. The smaller a business is, the more likely it is to suffer economic damage due to inundation. Businesses that attract consumers remotely or do not interact with consumers directly are less vulnerable to a shock caused by extreme inundation. Some studies revealed that businesses whose scale was relatively bigger before a disaster tend to cope better with post-disaster situations (Wasileski et al. 2011; Basker, E. and Miranda, J. 2018). In contrast, the retail business sector was expected to be vulnerable to inundation. Since retail businesses are more likely to depend on local customers, they will face inventory loss and sales interruption if extreme disaster damage occurs (Meltzer·Capperis 2017). Pearson, M.M. et al. (2011) used retail transaction demographic survey data to verify that sales of large distributors increased in New Orleans in the aftermath of Hurricane Katrina, while the average per store sales of individual retailers that sold automobiles, furniture, and electronics decreased. In other words, retail businesses do not have sufficient capital to pay for fixed expenditures such as monthly rent and repairs when they suffer damage. Washileski et al. (2011) revealed that wholesale and retail businesses are more likely to go out of business after a disaster as they are affected greatly by the local economy and consumer trust.
Existing data on damage have limitations in terms of identifying immediate changes depending on the characteristics of each region, as data that could be collected after a considerable time were used for research purposes. Due to this reason, a few studies attempted to discover damage characteristics within a region by using sales data. Meltzer, R., et al. (2020) noticed that sales decreases occurred mainly among retail businesses in the regions affected by Hurricane Sandy. While this may be attributable to direct impact from physical destruction, it was seen as a result of indirect impact from decreases in the resident population and income over time, as well as from weakened coherency among retail trades. Yang, L., et al. (2016) divided industries into six types (wholesale and retail, manufacturing, non-manufacturing, etc.) to analyze their economic losses due to heavy rains in the Tokai region of Japan. The study found that the decrease rate of sales can be an explanatory variable for the recession period of the business sector due to inundation. And also, such changes in sales were found to have a weak correlation with inundation depth and direct commercial damage. When the inundation depth exceeded 0.75 m, among the industrial sectors, manufacturing interruption increased exponentially, whereas non-manufacturing, and wholesale and retail sectors react relatively sensitively even at a low inundation depth of 0.25 m. In Korea, research using sales data to estimate inundation damage has been very insufficient so far. In particular, it is even impossible to total the sales damage due to business interruption suffered by small business owners4) who are mostly tenants paying rent. As such, Seon, C.N. et al. (2017) proposed a model to predict operational damage from inundation by using data on sales during general times based on credit card sales, and an inundation vulnerability function model.
3. Sub-conclusion
This study aims to demonstrate that typhoons and inundations have greater impact on declining areas with greater physical and social vulnerability factors than on general areas by using daily sales data.
The severity of damage from inundation varies depending on the characteristics of individual regions and causes of inundation. Despite this nature, prior studies that considered sales mainly dealt with business types and scales in terms of the level of damage and recovery. In addition, as declining areas are currently defined with eup, myeon, and dong units, research on inundation vulnerability considering the current scale of urban regeneration new deal projects is insufficient. Moreover, existing studies on inundation vulnerability had difficulties in validating a correlation with immediate damage. Due to declining population, relatively higher rates of vulnerable groups, deteriorated physical environments and weakened economic foundations, declining areas may suffer greater damage when inundation occurs. In other words, declining areas, due to their local economies lacking response capacity, may react more sensitively towards inundation damage, and thus, it is necessary to investigate up to which degree of actual damage that inundation vulnerability may inflict on a given area through sales data.
Existing urban regeneration projects have been implemented with the goal of reviving local economies in decline through various forms including community companies. However, the pursuit of urban regeneration projects without the consideration of inundation vulnerability of declining areas at an era when unpredictable disasters occur due to climate change may lead to another form of regional decline. Despite this, the current urban regeneration and revitalization areas and urban regeneration new deal projects have no consideration for disaster vulnerability factors. As such, basic research is required to illuminate the need for considering disaster vulnerability in selection of declining areas, as specified in the existing Special Act on Promotion of and Support for Urban Regeneration. Thus, this study was performed with the following assumptions: first, urban declining areas are related to factors of inundation vulnerability; second, factors of inundation vulnerability affect decreases in sales; third, urban declining areas are more sensitive to sales changes due to inundation than general areas.
Ⅲ. Method of Analysis
1. Study Area
This study focused on Ulsan Metropolitan City (hereinafter, “Ulsan”), which suffered damage due to typhoon Chaba on October 5, 2016. Ulsan’s urban district is formed around Taehwa River, with Dongcheon River joining Taehwa River from north to south. The city’s annual precipitation is 1,252.41 mm and its average yearly temperature is 14.1℃. According to the 2018 annual disaster bulletin, Ulsan recorded KRW 68.89 billion in property damage and 4 casualties due to typhoons and heavy rains over a five-year period from 2014 to 2018. In particular, typhoon Chaba that slammed the city on October 5, 2016 caused massive property damage amounting to KRW 61.2 billion won, 3 deaths, and 2,756 sufferers (National Disaster and Safety Portal, 2019). According to the Ulsan Meteorological Observatory, typhoon Chaba recorded a maximum precipitation of 100 mm per hour and cumulative precipitation of 266.0 mm, and areas in close proximity to the downtown and Taehwa River were inundated.
The spatial scope of this study covers Ulsan’s urbanization areas excluding non-urban areas, and census output area was used as the analysis unit. Figure. 1 shows the spatial range of urbanization areas in Ulsan. This study limited the scope to urbanization areas due to the following reasons: first, inundation damage in urbanization areas has strong man-made characteristics due to increases in impervious area resulting from high-density development and the existence of artificially formed underground space, and as such they tend to suffer huge damage during localized heavy rains (Shin, S. Y. et al., 2011); second, most declining areas are designated within urbanization areas5); third, it is difficult to examine sales changes in non-urbanization areas as their daily sales occurrence frequency is low.

Study area (Ulsan Metropolitan City)
In this study, census output areas are divided into urban declining areas and general areas. Among 61 areas that were designated for urban regeneration and revitalization in the Report on Changes for Strategic Plans for 2025 Urban Regeneration for Ulsan Metropolitan City, this study considered 51 declining areas located with urbanization areas. Urban regeneration revitalization areas refer to more than two areas that satisfy the indicators of decline diagnosis (demographic change, changes in the number of businesses, rates of deteriorated buildings) under Articles 13 and 17 of the Enforcement Degree of the Special Act on Promotion of and Support for Urban Regeneration, exclusive of development restricted areas, and that are divided into five business types.
Urban regeneration revitalization areas and urban regeneration new deal project areas, which are urban declining areas, do not match census output areas perfectly. This is because zones for urban regeneration projects are limited to within recommended areas for different business types. Due to this reason, this study considered a census output area that lies on the boundary of a project zone as an urban declining area. Therefore, this study had urban regeneration revitalization areas and census output areas overlap using Arc GIS10, and considered the overlapped census output areas as census output areas (N=244), and other areas as general areas (N=1,475) for analysis.
2. Data for Analysis
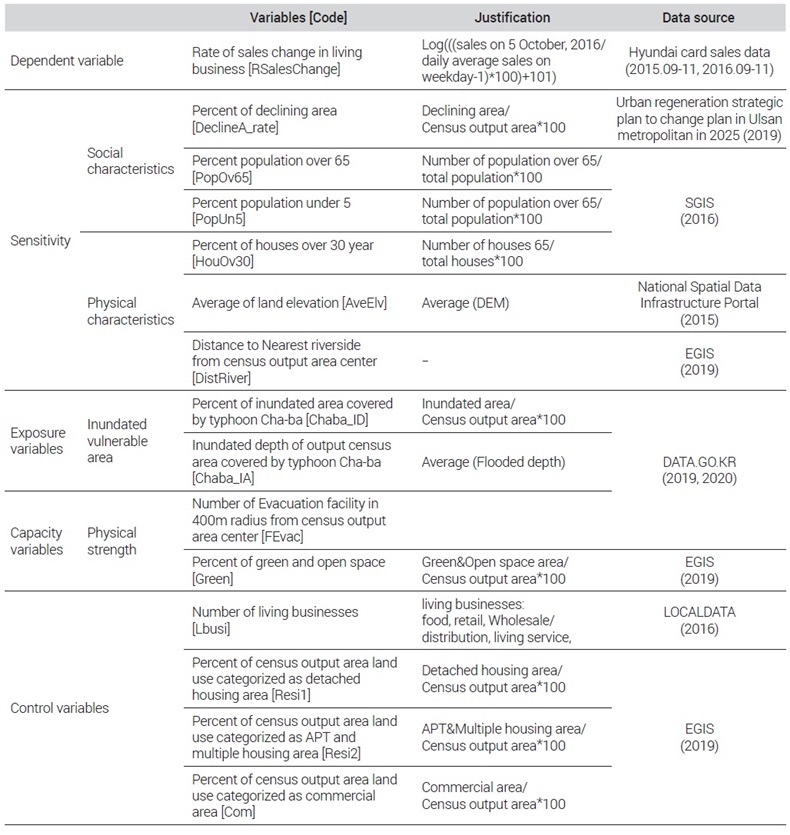
Table 1 shows the variables that are considered in this study and how they were calculated. For the dependent variables, sales data were used, while sensitivity, exposure, and adaptive capacity were established for the independent variables. The data obtained this way were re-processed based on the census output area unit to be used for this study’s analysis.

List of 15 indicator variables
Sales data6) used in this study were estimated using sales data from Hyundai Card, which were divided into small-scale spatial units. Sales data are provided in the small-scale unit because if sales data of different business sectors are provided, it may be possible to identify the sales amount of a particular store. Because small-scale spatial units are formed based on the 2016 census output area codes, the sum of the census output areas was calculated.
In order to compare the difference in the severity of damage from typhoons and inundation inflicted on different areas and to analyze factors of inundation vulnerability that affect the severity of damage, this study calculated the rate of sales change and considered it as a dependent variable in multiple regression analysis. To that end, daily sales data from September to November 2015, and from September to November 2016 were used. To see the trends in sales before and after typhoon and inundation damage, October 2016 - the month when inundation damage occurred due to Typhoon Chaba on October 5, 2016 - was set as the basis, and the preceding and suceeding months were considered. In addition, to discover sales at general times based on actual sales amount, daily sales data for 2015 were also considered. A time series comparison was performed on these trends found that changes in sales due to the typhoon and inundation damage in Ulsan showed a tendency to recover to the previous level within 1 to 2 days (Figure. 2).

Time series of daily average sales in total census output area (up) and flooded area (down)
Daily average sales were calculated to examine an area’s general sales. In particular, sales on weekends and holidays when sharp changes in sales are more likely to occur compared to weekdays were excluded. This is because irregular activities such as recreation activities and shopping mainly happen on weekends and holidays rather than on weekdays, which affect sales of a particular area. As such, the daily sales from September to November of 2015 and of 2016 were averaged, and the average daily sales was subtracted from the sales on the day of Typhoon Chaba to calculate the rate of sales change.
Sales data include 17 business categories - tourism/leisure, transportation, finance, wholesale/distribution, real estate, retail, accommodation, sports, food, medicine, manufacturing, living services, etc. This study considered sales of 1) wholesale/distribution, 2) retail, 3) food, and 4) living services which are closely related to everyday living, to better understand declining characteristics, location variability, as well as formation of business districts. Furthermore, as the national business survey provided by the National Statistic Office offers information on living businesses in our communities, only the aforementioned four types of businesses were considered to calculate daily sales per each census output area. However, it is difficult to regard this as accurate sales data because the data do not reflect cash sales or sales though specific apps.
This study considered variables that explain factors of inundation vulnerability in order to examine if urban declining areas are more vulnerable to inundation and if sales in these areas are affected more when a typhoon/heavy rain occurs. The data compiled were divided into (1) physical/social vulnerability characteristics (sensitivity), (2) areas vulnerable to inundation (exposure), and (3) physical strength (adaptive capacity), while land use and land cover (hereinafter, “LULC”) characteristics and the number of living businesses were considered as control variables.
For physical and social characteristics, the area of urban decline areas, the population aged 65 or over (hereinafter, “the 65-and-older population”), population aged 5 or younger (hereinafter, “the 5-and-younger population”), and the number of houses older than 30 years were obtained from the census output area data provided by the statistical geographical information service (SGIS), while the average land elevation of each census output area and the distance from the riverside to the center of each census output area were calculated by using ArcGIS 10.0 based on DEM data and LULC data provided by the National Spatial Infrastructure Portal. The area ratio of urban declining areas was calculated against the area of census output areas overlapping with the 51 areas designated for urban regeneration revitalization. In the multiple regression analysis, dummy variables (urban declining area=1, general area=0) were considered to analyze impact on sales depending on the existence of urban declining areas. For areas vulnerable to inundation, inundation trace map GIS data available on the Public Data Portal (2018) were used as a basis to calculate the inundation area ratio and average inundation depth as a result of Typhoon Chaba in 2016. For physical capacity, the area ratio of green and open space against census output areas was calculated using LULC GIS data provided by the National Spatial Infrastructure Portal. Moreover, by using evacuation facility location data (2019), the number of evacuation facilities located within a 400 m radius from the center of a census output area was calculated.
Since sales are influenced by location factors, LULC characteristics and the number of living businesses were used to control such factors. For LULC characteristics, the ratios of detached housing areas, multiple housing areas and commercial areas against the area of census output areas were calculated for use. Location data of business opening and closing provided by LOCAL DATA (2016) were used for the number of living businesses, and any business that had closed were excluded.
3. Analysis Method
This study was performed in three stages - comparison of daily time series changes, analysis of correlation, and multiple regression analysis. The comparison of daily time series changes involved sales patterns in Ulsan’s urban areas and changes in sales of each area inundated due to Typhoon Chaba. To compare increases and decreases in sales between flooded areas, they were standardized as Min-Max, as different areas generated different sales amounts. Then, the correlation between flooded areas and factors of inundation vulnerability was analyzed by separating urban declining areas from general areas. Multiple regression analysis was performed to analyze how factors of inundation vulnerability affected changes in sales. R-studio was used to draw results from the correlation analysis and multiple regression analysis.
The correlation analysis mainly dealt with the correlation between factors of inundation vulnerability and flooded areas, and compared urban declining areas with general areas. Prior to this, basic statistical analysis was performed to obtain statistical data from flooded areas and non-flooded areas, as well as urban declining areas and general areas within flooded areas to compare factors of vulnerability. For quantification, this study used the Pearson correlation coefficient, which explains the degree of linear correlation between two variables. If the Pearson correlation coefficient is a positive (+) value, it means that there is a correlation between the two variables where an increase in the value of one variable leads to an increase in the value of the other variable.
The multiple regression analysis was performed with two models. Model 1 explains the impact urban declining areas and factors of inundation vulnerability have on changes in sales on the day of typhoon and inundation occurrence. In Model 2, a multiple regression analysis was performed only on flooded areas to demonstrate that urban declining areas are more vulnerable to inundation than general areas. Equation (1) is the multiple regression analysis model used in this study:
| (1) |
Ci: Rate of sales change
Decline Ai: Percentage of urban declining areas
PopOv65i: The 65-and-older population
HouOv30i: The number of houses older than 30 years
AveElei: Elevation, DistRiveri: Distance from the river
ChabaFDi: Average flooded depth
Greeni: The ratio of green area,
FEvaci: The number of evaculation facilities within a 400 m radius
f(control factors): Lbusi (the number of living businesses), Resi1, Resi2, Com (detached housing, multiple housing, commercial), Sales-Vari (sales increase or decrease)
ϵi: Error term
This model excluded the 5-and-younger population and inundation areas that showed a high correlation among certain variables in Table 3. The rate of sales change, considered as a dependent variable, used variables of a total of 1,170 census output areas by using box-plot, exclusive of outliers and cases where sales remained 0 for over 30 days out of 122 days. The rate of sales change is represented as a positive or a negative value, and is obtained by adding 101 to the minimum value and taking the log. As all values of the dependent variable turn positive, the model is completed by adding sales increase areas (=0) and sales decrease areas (=1) as dummy variables to reflect damage characteristics. For Model 2, as the scope was already limited to flooded areas, the multiple regression analysis was performed by excluding control variables.
Ⅳ. Analysis Results
1. Descriptive Statistical Analysis Results
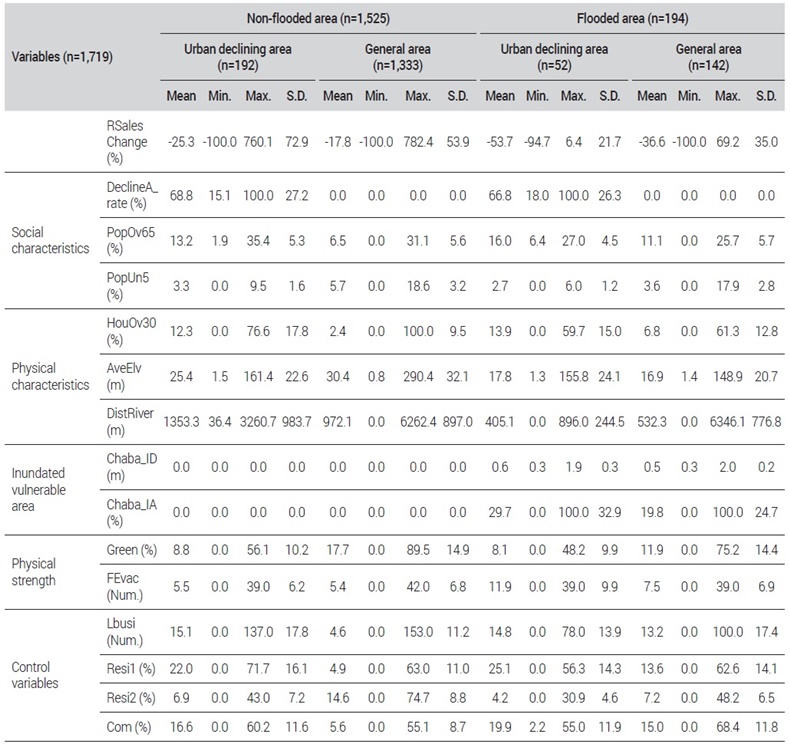
Descriptive statistical analysis was performed between urban declining areas and general areas depending on occurrence of inundation to see if the former has additional factors that make them more vulnerable to inundation compared to the latter (Table 2).
Descriptive statistics
As for the average value of the rate of sales change, which is a dependent variable, among non-flooded areas, the rate was -25.3% for urban declining areas and -17.8% for general areas, while among flooded areas, the rate was -53.7% for urban declining areas and -36.6% for general areas. Regardless of whether or not inundation occurred on the day of the typhoon, the overall daily average sales decreased, and the rates of decrease were 28.4% and 18.8% more in urban declining areas and general areas within flooded areas, respectively, than those within non-flooded areas. This difference seems to have been caused by the inundation depth and the inundation area. While the inundation depth and the inundation area for urban declining areas were 0.6 m and 29.7% on average, respectively, they were 0.5 m and 19.8% on average, respectively, for general areas.
As for physical characteristics, in urban declining areas within non-flooded areas, the number of houses older than 30 years accounted for 12.3%, its average land elevation was 25.4 m, and the distance from the riverside was 1353.3 m, while in general areas, they were 6.8%, 30.4 m, and 972.1 m, respectively. On the contrary, in urban declining areas within flooded areas, the number of houses older than 30 years accounted for 13.9%, its average land elevation was 17.8 m, and the distance from the riverside was 405.1 m, while in general areas, they were 6.8%, 16.9 m, and 523.3 m, respectively. In other words, these figures show that the physical environment of urban declining areas is under conditions that are relatively more prone to inundation damage. However, it seems that geographical factors such as the distance from the riverside or the average land elevation greatly influence the occurrence of inundation.
For demographic and social characteristics, the average area ratio of urban declining areas was 68.8% in non-flooded areas, while it was 66.8% in flooded areas. Irrespective of inundation occurrence, the average values for the 65-and-older population in urban declining areas were 13.2% and 16.0%, respectively, while they were 6.5% in non-flooded areas in general areas and 11.1% in flooded areas, approaching the level of urban declining areas. In urban declining areas and general areas in non-flooded areas, the average values for the 5-and-younger population were 3.3% and 6.5%, respectively, while they were 2.7% and 3.6%, respectively, in flooded areas.
Irrespective of inundation occurrence, as for physical capacity characteristics, urban declining areas showed a lower ratio of green space than general areas, but surprisingly, urban declining areas had a larger number of evacuation facilities. The average ratio of green space for urban declining areas was 8.8% and 8.1%, respectively, and the average number of evacuation facilities within a 400 m radius was 5.5 and 11.9, respectively. Meanwhile, the average ratio of green space for general areas was 17.7% and 11.9%, respectively, and the average number of evacuation facilities within a 400 m radius was 5.4 and 7.5, respectively. urban declining areas had the largest number of evacuation facilities within a 400 m radius, and this is presumably because there are apartment complexes in the vicinity and each apartment building is designated as an evacuation facility.
As for the average number of living businesses, urban declining areas and general areas among non-flooded areas had 15.1 and 4.6 businesses, respectively, while urban declining areas and general areas among flooded areas had 14.8 and 13.2 businesses, respectively. This indicates that there are more living businesses in flooded areas and that urban declining areas had relatively more living businesses. Lastly, as for LULC characteristics, urban declining areas of non-flooded areas had 22.0% of detached housing, 6.9% of multiple housing, and 16.6% of commercial area on average, while general areas had 4.9% of detached housing, 14.6% of multiple housing, and 5.6% of commercial area on average. urban declining areas of flooded areas had 25.1% of detached housing, 4.2% of multiple housing, and 19.9% of commercial areas, while general areas had 13.6% of detached housing, 7.2% of multiple housing, and 15.0% of commercial areas on average.
2. Analysis Results of Correlation between Sales Changes, Urban Declining Areas and Factors of Inundation Vulnerability
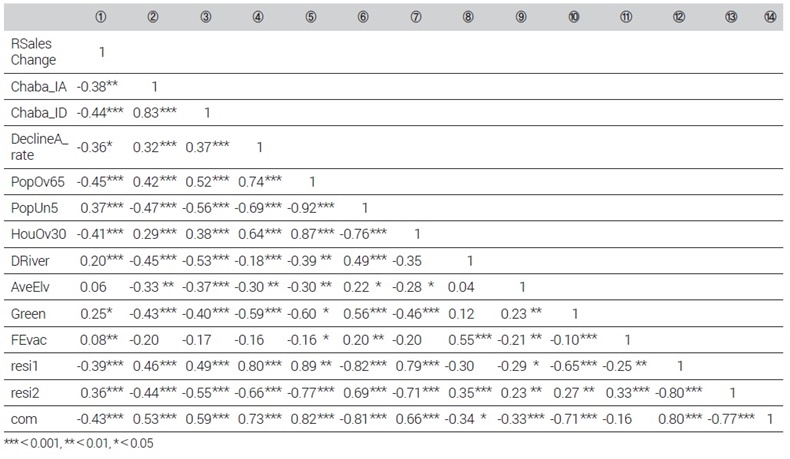
Table 3 shows results of the analysis that examined to which degree the rate of sales change as the dependent variable is related to factors of inundation vulnerability, and the correlation between urban declining areas and factors of inundation vulnerability.
Result of correlation analysis
The analysis of the correlation between changes in sales and factors of inundation vulnerability found that the rate of sales change had negative (-) correlations with the area ratio of inundation, inundation depth, the area ratio of declining areas, and the rates of the 65-and-older population, houses older than 30 years, detached housing areas, and of commercial areas. These can be considered factors of inundation vulnerability that affect sales decreases. On the contrary, the rate of sales change had positive (+) correlations with the 5-and-younger population, distance from the nearest riverside, average land elevation, ratio of green areas, the number of evacuation facilities, and the ratio of multiple housing areas. Among these, the average land elevation and the number of evacuation facilities were found to have very weak correlation. However, as for the relationship between the inundation area and influence variables, the average land elevation and the number of evacuation facilities were found to decrease inundation damage by -0.33 and -0.20, respectively.
The analysis of the correlation between urban declining areas and factors of inundation vulnerability found that the area ratio of declining areas had positive (+) correlations with the inundation area and inundated depth, and positive (+) correlations with the rates of the 65-and-older population, houses older than years, detached housing areas, and of commercial areas. On the contrary, it had negative (-) correlations with the 5-and-younger population, distance from the nearest riverside, average land elevation, ratio of green areas, the number of evacuation facilities, and the ratio of multiple housing areas. This suggests that influence variables related to urban declining areas are related to variables that are major causes of inundation damage.
3. Results of Multiple Regression Analysis
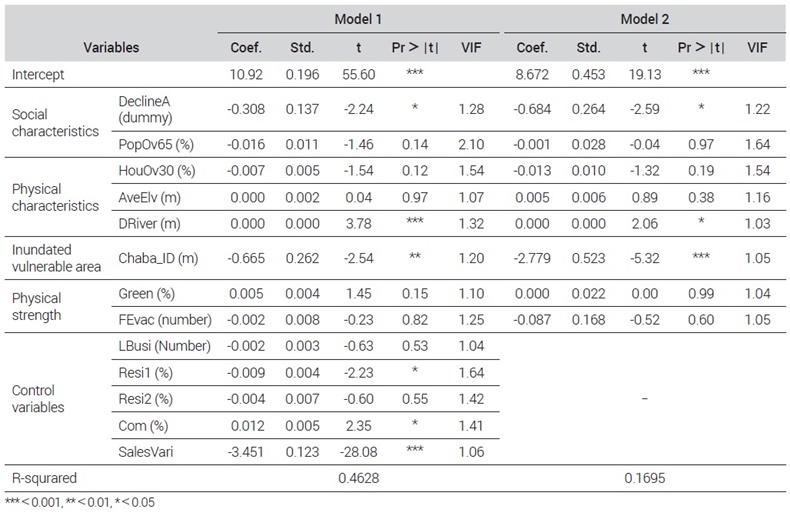
Table 4 shows results of the multiple regression analysis that used Model 1 to explain the impact urban declining areas and factors of inundation vulnerability have on changes in sales, and Model 2 to evaluate how vulnerable urban declining areas are to inundation compared to general areas. Their model explanatory power was 46.3% and 17.0%, respectively, and the VIF outcomes were all under 10, showing no multicollinearity.
Result of Multiple regression model
When the LULC characteristics and the number of living businesses are controlled, urban declining areas in Model 1 were found to influence decreases in sales following inundation more than general areas. However, the 65-and-older population and houses older than 30 years, which are sensitive factors that have high relevance to urban declining areas, were found to be statistically insignificant. Distance from the nearest riverside, however, showed a positive (+) relationship to sales changes, and the farther the area was from the nearest riverside, the smaller the decrease in sales became. Inundation depth was found to be the factor that affects sales decreases following inundation the most. Inundation depth showed a negative (-) relationship to sales, and the greater inundation depth was, the bigger the decreases in sales became. The ratio of green area showed a positive (+) relationship to sales change, while the number of evacuation facilities within a 400 m radius showed a negative (-) relationship to sales change. It was believed that an area with a bigger ratio of green space and a bigger number of evacuation facilities, both representing physical strength, would have smaller deceases in sales, but they did not have statistical influence.
The ratios of detached housing and commercial areas, considered as control variables, were found to have statistical significance. Among the LULC characteristics, the ratios of detached housing and multiple housing showed a negative (-) relationship, and the higher the ratio of detached housing areas was, the bigger the decreases in sales became. The ratio of commercial areas, on the contrary, showed a positive (+) relationship to the sales change. While the number of living businesses showed a negative (-) relationship, it was not statistically significant.
Compared to the outcomes of Model 1, Model 2 had an explanatory power of 17.0%, and urban declining areas were found to be more sensitive to inundation damage than general areas. Although the statistical explanatory power is low, it can be interpreted that urban declining areas showed greater decreases in sales due to inundation than general areas, and thus are more vulnerable to inundation. In Model 2, the distance from the nearest riverside and inundation depth were found to be the factors of inundation vulnerability that affected sales change.
Ⅴ. Discussions
This study performed an empirical analysis to see if urban declining areas with greater physical and social vulnerability factors are more vulnerable to typhoons and inundation damage by using daily sales data. Although urban declining areas are related to factors of disaster vulnerability, urban regeneration revitalization plans have been implemented without consideration of such vulnerability. Moreover, urban declining areas, due to their weakened economic foundation, are likely to react relatively sensitively to inundation damage. As such, this study analyzed the impact the factors of inundation vulnerability have on sales changes and inundation vulnerability of urban declining areas using multiple regression analysis models, involving urbanization areas in Ulsan Metropolitan City that suffered severe damage from Typhoon Chaba on October 5, 2016. From this, the study aimed to shed light on the need for disaster response at the level of urban regeneration projects in order to reduce damage on urban declining areas that are vulnerable to inundation.
Urban declining areas in this study were found to have more sensitive factors to inundation. Declining areas that were examined in this study are urban regeneration revitalization areas and urban regeneration new deal project areas that were designated by local governments based on such indicators as population, businesses, and building characteristics as specified in the Special Act on Promotion of and Support for Urban Regeneration. Such declining areas are often characterized by deteriorated physical environment and a relatively higher proportion of vulnerable groups. This means that the correlation between factors related to inundation damage and sensitivity was found to be not greatly different from the findings of previous studies (Yeo, C.G. et al., 2011; Park, C.Y. et al., 2013; Seo, J.S. and Han, W.S., 2019). However, not all urban declining areas experienced inundation. As shown in Table 2, there are urban declining areas and general areas even among flooded areas, and they often have lower average land elevation and are closer to the riverside compared to non-flooded areas. The distance from the nearest riverside, in particular, was found to be a major variable that affects sales change. While it is unclear if the ratio of green space as a factor of physical strength affects sales change directly, it is a major factor that reduces inundation vulnerability by raising water permeability, and thus, the different ratios of green space between urban declining areas and general areas are believed to be associated with the severity of inundation damage. Therefore, urban declining areas will need a plan to prepare for inundation in consideration of river overflows due to heavy rains and geographical location.
urban declining areas showed bigger decreases in sales due to inundation compared to general areas. Regardless of inundation, urban declining areas showed bigger decreases in sales on average compared to general areas (see Table 2). Furthermore, it was found that in urban declining areas, the distance from the nearest riverside and inundation depth influenced deceases in sales due to inundation damage. This is attributable to the fact that urban declining areas react more dramatically to external impact such as a disaster, in addition to deteriorated residential environments and declining local economy (Ko, D., 2015; Park, K.A. et al., 2018). However, while it is unclear in this study if higher rates of the 65-and-older population and detached houses older than 30 years affect decreases in sales more, they were found to be related to sales decreases. The fact that greater sales decreases are found in urban declining areas may be attributable to their environmental characteristics - that is, these areas have relatively higher ratios of detached housing but this is seemingly because living businesses are mixed in residential areas. Commercial and business areas, on the contrary, were found to influence increases in sales as large-scale distributors and companies are located in those areas.
Inundation depth was found to be a major factor that affect sales change. In general, inundation area was often considered when assessing inundation vulnerability. However, recession time is important when considering impact on local economy. The greater inundation depth is, the longer recession time gets, and as such, this has critical impact on sales decreases due to such damage as inventory loss and business interruption. It seems that greater inundation depth is associated with its proximity to a river, lower land elevation, higher rates of detached housing and commercial areas, and lack of green space. In this study, the inundation depth of flooded areas was 0.5-0.6 m on average, and the daily sales tended to recover the pre-disaster level after 1 to 2 days. This is attributable to quick drainage after inundation or support provided from local governments in the form of emergency recovery efforts.
However, inundation damage can last long-term, and the area surrounding Taehwa Market that suffered the most damage recorded inundation depth of 1.2 m on average and maximum 1.9 m. Unlike other areas, Taehwa Market and its vicinity exhibited long-term inundation damage (Figure. 3). This particular area is planned as an urban regeneration revitalization area (general neighborhood type) and is in the vicinity of the river, but it has a less elevated topography than surrounding areas, which makes it easy for water to stay in. It is a severely deprived area with a higher rate of living businesses, where detached housing and deteriorated buildings account for 62.3% and 91.9%, respectively. In the wake of Typhoon Chaba on October 5, 2016, the community surrounding Taehwa Market recorded a decline in sales and and it took around 15 to 20 days for the sales to rebound to the pre-Chaba level. The temporary surge in sales after inundation damage is believed to be a result of emergency recovery efforts to which a large scale of personnel and equipment were committed.

Daily change of normalized sales in Tae-Hwa Market area (Sep. to Nov. in 2015 and 2016)
This study has the following limitations. Firstly, the data for sales have great variability as they are based on Hyundai Card’s sales data, which were totaled by including estimated sales in cash. Moreover, it is possible that the damage in residential areas is underestimated. Secondly, the study focused only on short-term damage for its analysis, despite the possibility that inundation damage may last over the long run. Lastly, despite the fact that sales loss can be caused not just by physical characteristics but also by various factors including company size and business type, the study only considered a limited number of variables. Not withstanding these limitations, this study is significant in that it focused on the scale of urban regeneration projects to illuminate the correlation with factors of inundation vulnerability in urban declining areas, while using daily average sales data to empirically demonstrate that inundation inflicts greater damage to urban declining areas. Although this study could not analyze long-term damage of inundation and level of recovery from it due to limitations in data, future studies will need to assess urban resilience from a disaster by considering differences in physical and social capacity.
Ⅵ. Conclusion
This study is meaningful in the sense that it performed an empirical analysis to verify if urban declining areas are vulnerable to actual inundation by using daily average sales data, and that it identified the need for disaster response in the existing urban regeneration projects. Major findings of this study can be summarized as follows. First of all, urban declining areas have more factors that are sensitive to inundation. Secondly, among flooded areas, urban declining areas saw greater decreases in sales than general areas. However, additional research is needed for the sales data to serve as an absolute indicator that can be used to validate inundation vulnerability. Lastly, inundation depth was a major factor that influenced changes in sales.
To respond to inundation, this study proposes urban regeneration measures that take the characteristics of declining areas into consideration as follows. First, an institutional framework must be put in place in order to reflect disaster vulnerability analysis when establishing strategic plans for urban regeneration to respond better to inundation. Because Korea’s declining areas react more severely to inundation damage, the National Land Planning and Utilization Act (2012) was amended to include a Comprehensive Plan for Storm and Flood Damage Reduction in basic urban planning for urban regeneration by local governments. As a result, disaster vulnerability analysis in consideration of climate change became mandatory in all basic urban planning established and modified from July 2012. However, at the current stage of strategic planning of urban regeneration, little consideration is given to an institutional basis for disaster vulnerability analysis that takes spatial characteristics of urban declining areas into account, and the criteria for applying it to the scale of urban regeneration projects are insufficient. Second, urban regeneration revitalization plans must include a survey on geographical locations and risk factors of urban declining areas, as well as urban planning measures suitable for urban declining areas to reduce inundation depth. Last, an institutional support system is needed to strengthen coherency among retail businesses in urban declining areas against disaster damage. While urban regeneration projects are being implemented in various forms including community companies to revitalize the regional economy on decline, damage from an unforeseen disaster may lead to another recession in the region. Therefore, it is necessary to consider developing support measures in the form of storm and flood insurance, or funding such measures partially.
Acknowledgments
This work is supported by the Korea Agency for Infrastructure Technology Advancement(KAIA) grant funded by the Ministry of Land, Infrastructure and Transport (Grant 21TSRD-B151228-03).
References
- Anderson, M., 1995. “Vulnerability to Disaster and Sustainable Development: a General Framework for Assessing Vulnerability.” in Disaster Prevention for Sustainable Development: Economic and Policy Issues, edited by Mohan Munasinghe, Caroline Clarke, 41-59. The International Bank for Reconstruction and Development, The World Bank, Washington.
-
Atreya, A., Ferreira, S., and Kriesel, W., 2013. “Forgetting the Flood?: an Analysis of the Flood Risk Discount over Time”, Land Economics, 89(4): 577-596.
[https://doi.org/10.3368/le.89.4.577]

-
Basker, E. and Miranda, J., 2018. “Taken by Storm: Business Financing and Survival in the Aftermath of Hurricane Katrina”, Journal of Economic Geography, 18(6): 1285-1313.
[https://doi.org/10.1093/jeg/lbx023]
-
Cutter, S.L., 1996. “Vulnerability to Environmental Hazards”, Progress in Human Geography, 20(4): 529-539.
[https://doi.org/10.1177/030913259602000407]
-
Hallstrom, D.G. and Smith, V.K., 2005. “Market Responses to Hurricanes”, Journal of Environmental Economics and Management, 50(3): 541-561.
[https://doi.org/10.1016/j.jeem.2005.05.002]
-
Jang, O.J. and Kim, Y.O., 2009. “Flood Risk Estimation Using Regional Regression Analysis”, Journal of The Korean Society of Hazard Mitigation, 9(4): 71-80.
장옥재·김영오. 2009. “지역회귀분석을 이용한 홍수피해위험도 산정”. 「한국방재학회논문집」, 9(4): 71-80. -
Jung, J.C., Lee, S.B., Sagong, H., Lee, J.H., and Lee, D.B., 2007. Hazard Mitigation Policy for Sustainable Development: Flood Mitigation through Land Use Planning and Management, Seoul: Korea Environment Institute.
정주철·이상범·사공희·이지현·이달별. 2007. 「자연친화적인 자연재해완화정책에 관한 연구」, 서울: 한국환경정책평가연구원. -
Kang, H.W., 2015. “A Study on the Urban Flood Vulnerability Assessment for Urban Area Considering Climate Change -A Case Study of Dorim Stream Basin-”, Master’s Dissertation. University of Seoul.
강현웅, 2015. “기후변화를 고려한 도시지역의 도시홍수 취약성 평가에 관한 연구”, 서울시립대학교 대학원 석사학위논문. -
Kim, M.J. and Kim, G.S., 2018. “Analysis of the Applicability of Flood Risk Indices according to Flood Damage Types”, Journal of the Korean Society of Civil Engineers, 38(1): 29-39.
김묘정·김광섭, 2018. “홍수피해유형별 홍수 위험 지수 적용성 분석”, 「대한토목학회논문집」, 38(1): 29-39. -
Kim, B.K., Jang, D.W., Jang, N., and Yang, D.M., 2011. “The Deduction of Urban Flood Risk Factor Considering Climate Change”, Journal of Safety and Crisis Management, 7(1): 125-142.
김보경·장대원·장남·양동민, 2011. “기후변화를 고려한 도시홍수 위험요인 도출”, 「한국위기관리논집」, 7(1): 125-142. -
Kim, C. and Kim, S.G., 2003. “Estimation of Inundation Area and Calculation of the Temporary Restoration Expenses Using GIS”, Journal of the Korean Society of Civil Engineers, 23(4B): 233-239.
김철·김석규, 2003. “GIS 를 이용한 침수지역 예측 응급복구비 산정”, 「대한토목학회논문집 B」, 23(4B): 233-239. -
Kim, H.S., Park, G.J., Kim, S.D., Choi, M.H., Park, M.J., and Yoon, J.Y., 2012. “Assessment of Flood Vulnerability Considering Climate Change and Large-scale River Restoration Project”, Journal of The Korean Society of Hazard Mitigation, 12(2): 107-113.
[
https://doi.org/10.9798/KOSHAM.2012.12.2.107
]
김환석·박기정·김상단·최민하·박무종·윤재영, 2012. “기후변화와 대규모 하천정비 사업을 고려한 낙동강 유역 자연재해 홍수 취약성 평가”, 「한국방재학회논문집」, 12(2): 107-113. -
Kim, J.Y., Park, J.H., Cho, B.H., and Lee, S.S., 2020. “A Comparative Analysis of Disaster Vulnerability Factors between Declining Areas and Urban Areas”, Journal of Digital Contents Society, 21(11): 2021-2032.
[
https://doi.org/10.9728/dcs.2020.21.11.2021
]
김지영·박종화·조병호·이삼수, 2020. “쇠퇴지역과 도시지역의 재난 취약요인 비교·분석”, 「한국디지털콘텐츠학회 논문지」, 21(11): 2021-2032. -
Ko, D.H., 2015. “Hurricane Katrina as Unnatural Disaster: Government Failure and Inequality of Risk”, Korea Social Policy Review, 22(1): 83-119.
[
https://doi.org/10.17000/kspr.22.1.201503.83
]
고동현, 2015. “사회적 재난으로서 허리케인 카트리나: 정부 실패와 위험 불평등”, 「한국사회정책」, 22(1): 83-119. -
Lee, K.M., Choi, J.W., and Jeon, K.S., 2016. “An Approach of Social Vulnerability Assessment to Urban Flood”, Journal of The Korean Society of Hazard Mitigation, 16(4): 43-51.
[
https://doi.org/10.9798/KOSHAM.2016.16.4.43
]
이규민·최진원·전경수, 2016. “도시홍수에 대한 사회적 취약성 평가에 대한 연구”, 「한국방재학회논문집」, 16(4): 43-51. -
Lee, G.S. and Park, J.H., 2011. “Flood Damage Assessment according to the Scenarios Coupled with GIS Data”, Journal of Korean Society for Geospatial Information System, 19(4): 71-80.
이근상·박진혁, 2011. “GIS 자료와 연계한 시나리오별 홍수피해액 분석”, 「대한공간정보학회지」, 19(4): 71-80. -
Lee, M.J. and Kang, J.E., 2012. “Predictive Flooded Area Susceptibility and Verification Using GIS and Frequency Ratio”, Journal of the Korean Association of Geographic Information Studies, 15(2): 86-102.
[
https://doi.org/10.11108/kagis.2012.15.2.086
]
이명진·강정은, 2012. “빈도비 모델과 GIS을 이용한 침수 취약 지역예측 기법 개발 및 검증”, 「한국지리정보학회지」, 15(2): 86-102. -
Lee, M.W., Kim, T.W., and Moon, G.W., 2013. “Assessment of Flood Damage Vulnerability Considering Regional Flood Damage Characteristics in South Korea”, Journal of The Korean Society of Hazard Mitigation, 13(4): 245-256.
[
https://doi.org/10.9798/KOSHAM.2013.13.4.245
]
이민우·김태웅·문건우, 2013. “우리나라의 지역별 홍수피해 특성을 고려한 홍수피해 취약성 평가”, 「한국방재학회논문집」, 13(4): 245-256. -
Lee, B.J., Kim, H.Y., and Kim, S.Y., 2018. “Changes in Climate Change Flood Vulnerability for National Territories”, Journal of The Korean Society of Hazard Mitigation, 18(6): 27-33.
[
https://doi.org/10.9798/KOSHAM.2018.18.6.27
]
이병재·김학열·김소윤, 2018. “기후변화 홍수에 대한 국토 취약성 변화 분석 연구”, 「한국방재학회논문집」, 18(6): 27-33. -
Lee, S.H. and Kang, J.E., 2018. “Urban Flood Vulnerability and Risk Assessments for Applying to Urban Planning”, Journal of Korea Planning Association, 53(5): 185-206.
[
https://doi.org/10.17208/jkpa.2018.10.53.5.185
]
이상혁·강정은, 2018. “도시계획 적용을 위한 도시홍수 취약성 및 리스크 평가”, 「국토계획, 53(5): 185-206. -
Lee, J.S. and Choi, H.N., 2018. “Comparison of Flood Vulnerability Assessment Outcomes by Classification Schemes for Vulnerability Components to Climate Change”, Journal of The Korean Society of Hazard Mitigation, 18(3): 221-229.
[
https://doi.org/10.9798/KOSHAM.2018.18.3.221
]
이종석·최현일. 2018. “기후변화취약성 평가지표 분류체계에 따른 홍수취약성 평가결과의 비교”, 「한국방재학회논문집」, 18(3): 221-229. - McCarthy, J.J., Canziani, O.F., Leary, N.A., Dokken, D.J., and White, K.S., 2001. Climate Change 2001: Impacts, Adaptation, and Vulnerability: Contribution of Working Group II to the Third Assessment Report of the Intergovernmental Panel on Climate Change (Vol. 2), Cambridge: Cambridge University Press.
-
Meltzer, R., and Capperis, S., 2017. “Neighbourhood differences in retail turnover: Evidence from New York City”. Urban Studies, 54(13): 3022-3057.
[https://doi.org/10.1177/0042098016661268]
-
Meltzer, R., Ellen, I.G., and Li, X., 2020. “Localized commercial effects from natural disasters: The case of hurricane sandy and new york city”. Regional Science and Urban Economics, 86: 103608.
[https://doi.org/10.1016/j.regsciurbeco.2020.103608]
-
Myers, C.A., Slack, T., and Singelmann, J., 2008. “Social vulnerability and migration in the wake of disaster: the case of Hurricanes Katrina and Rita”, Population and Environment, 29(6): 271-291.
[https://doi.org/10.1007/s11111-008-0072-y]
-
Park, C.Y., Shin, S.Y., and Son, E.J., 2013. “Classifying Flood Prone Areas in Seoul Using Multivariate Analysis”, Journal of The Korean Society of Hazard Mitigation, 13(2): 245-255.
[
https://doi.org/10.9798/KOSHAM.2013.13.2.245
]
박창열·신상영·손은정. 2013. “다변량 분석을 이용한 서울의 상습침수지역 유형화”, 「한국방재학회논문집」, 13(2): 245-255. -
Park, D.H., Ahn, J.H., and Choi, Y.J., 2011. “Correlation between Storm Characteristics and Flood Damage”, Korean Wetlands Society, 13(2): 219-229.
박두호·안재현·최용준, 2011. “우리나라 호우특성과 홍수피해와의 상관관계”, 「한국습지학회지」, 13(2): 219-229. -
Park, H.N. and Song, J.M., 2014. “Empirical Study on Environmental Justice through Correlation Analysis of the Flood Vulnerability Indicator and the Ratio of the Poor Population”, Journal of Korea Planning Association, 49(7): 169-186.
[
https://doi.org/10.17208/jkpa.2014.11.49.7.169
]
박한나·송재민, 2014. “침수 취약성 지표와 사회적 취약계층 비율 간의 상관관계 분석을 통한 환경정의 실증 연구”, 「국토계획」, 49(7): 169-186. -
Park, J.K., 2016. “Climate change, Disaster Vulnerability Assessment Considering the Small City of Properties”, Journal of Korean Society of Environmental Administartion, 22(1): 31-36.
박정규, 2016. “소규모 도시특성을 고려한 기후변화 재해취약성 평가”, 「환경관리학회지」, 22(1): 31-36. -
Park, K.A., Kim, J.G., and Park, M.A., 2018. “Urban Regeneration Considerated on Safety Vulnerability of Port Hinterland Residential Area-Focused on Dong-Gu and Nam-Gu of Busan Metropolitan City”, Journal of The Korean Society of Civil Engineers, 38(5): 761-769.
박강아·김종구·박민아, 2018. “항만배후 주거지역의 안전 취약성을 고려한 도시재생: 부산광역시 동구와 남구를 대상으로”, 「대한토목학회논문집」, 38(5): 761-769. -
Pearson, M.M., Hickman, T.M., and Lawrence, K.E., 2011. “Retail Recovery from Natural Disasters: New Orleans versus Eight Other United States Disaster Sites. The International Review of Retail”, Distribution and Consumer Research, 21(5): 415-444.
[https://doi.org/10.1080/09593969.2011.619665]
-
Rheem, S.K. and Lee, C.G., 2013. “A Study on the Relationship between Urban Decline and Disaster”, Crisisonomy, 9(9): 25-44.
임상규·이창길, 2013. “도시의 쇠퇴현상과 재난발생과의 관계분석”, 「Crisisonomy」, 9(9): 25-44. -
Saldaña-Zorrilla, S.O. and Sandberg, K., 2009. “Impact of Climate-related Disasters on Human Migration in Mexico: a Spatial Model”, Climatic Change, 96(1-2): 97.
[https://doi.org/10.1007/s10584-009-9577-3]
-
Samarasinghe, O. and Sharp, B., 2010. “Flood Prone Risk and Amenity Values: a Spatial Hedonic Analysis”, Australian Journal of Agricultural and Resource Economics, 54(4): 457-475.
[https://doi.org/10.1111/j.1467-8489.2009.00483.x]
-
Shin, S.Y. and Park, C.Y., 2014. “Analyzing Relationships between Land Use Characteristics and Flood Damage Areas : The Case of Seoul”, The Korea Spatial Planning Review, 81: 3-20.
[
https://doi.org/10.15793/kspr.2014.81..001
]
신상영·박찬열, 2014. “토지이용 특성과 침수피해면적 간의 관계 분석: 서울시를 사례로”, 「국토연구」, 81: 3-20. -
Shin, S.Y., Lee, S.M., and Park, M.K., 2011. “Seoul’s Flood Prevention Strategy in Response to Extreme Weather”, SDI Policy Report, (96): 1-23.
신상영·이석민·박민규, 2011. “기상이변에 대응한 서울의 수해방지전략”, 「정책리포트」, (96): 1-23. -
Sim, J.S., Kim, J.S., and Lee, S.H., 2014. “Local Analysis of the Spatial Characteristics of Urban Flooding Areas Using GWR”, Journal of Environmental Impact Assessment, 23(1): 39-50.
[
https://doi.org/10.14249/eia.2014.23.1.39
]
심준석·김지숙·이성호. 2014. “지리가중회귀모델을 이용한 도시홍수 피해지역의 지역적 공간특성 분석”, 「환경영향평가」, 23(1): 39-50. -
Seo, J.S. and Han, W.S., 2019. “Exploring the Relationship between Floods and Socially Vulnerable Groups: The Case of Jeju”, Journal of The Korean Society of Hazard Mitigation, 19(4): 103-113.
[
https://doi.org/10.9798/KOSHAM.2019.19.4.103
]
서정석·한우석, 2019. “침수 취약지역과 사회적 취약계층의 공간적 상관성 분석: 제주특별자치도 사례를 중심으로”, 「한국방재학회논문집」, 19(4): 103-113. -
Seon, C.N., Cho, M.H., and Song, S.K., 2017. “The Estimation Method of Operational Damage from Inundation for Small Businesses Using Sales Data”, Conference Journal of Computing Science and Engineering, 42-44.
선충녕·조민희·송사광, 2017. “매출 데이터를 이용한 침수 재난 소상공인 운영피해 추정 방법”, 「한국정보과학회 학술발표논문집」, 42-44. -
Son, M.S., Park, J.Y., and Kim, H.S., 2013. “Urban Environmental Risk–Evaluating Flooding Risk Indices of Seoul”, Seoul studies, 14(4): 127-140.
손민수·박지영·김홍석, 2013. “서울시 도시환경의 홍수 위험도 평가”, 「서울도시연구」, 14(4): 127-140. -
Wang, G.I., Yu, S.C., and Noh, K.S., 2014. “Establishing Direction of Urban Regeneration Policy Tasks and Strategic Plan to Respond Climate Change”, KRIHS Policy Brief, 16(4): 53-77.
왕광익·유선철·노경식 2014. 기후변화 대응 도시재생 정책과제 및 전략계획 수립방향. 「국토정책 Brief」, 16(4): 53-77. -
Wasileski, G., Rodríguez, H., and Diaz, W., 2011. “Business Closure and Relocation: a Comparative Analysis of the Loma Prieta Earthquake and Hurricane Andrew”, Disasters, 35(1): 102-129.
[https://doi.org/10.1111/j.1467-7717.2010.01195.x]
-
Weong, J.H. and Jung, D.H., 2017. “The Effect on Entrepreneurial Characteristics of Small Business Management Performance”, Journal of Business Venturing and Entrepreneurship, 2(1): 111-121.
[
https://doi.org/10.16972/apjbve.12.1.201702.111
]
원종하·정대현, 2017. “소상공인의 기업가특성이 경영성과에 미치는 영향”, 「벤처창업연구」, 2(1): 111-121. -
Yang, L., Kajitani, Y., Tatano, H., and Jiang, X., 2016. “A Methodology for Estimating Business Interruption Loss Caused by Flood Disasters: Insights from Business Surveys after Tokai Heavy Rain in Japan.” Natural Hazards, 84(1): 411-430.
[https://doi.org/10.1007/s11069-016-2534-3]
-
Yeo, C.G., Seo, G.S., and Song, J.W., 2011. “Regional Safety Assesment due to Urban Flood using GIS”, Journal of the Korean Association of Geographic Information Studies, 14(3): 68-77.
[
https://doi.org/10.11108/kagis.2011.14.3.068
]
여창건·서근순·송재우, 2011. “GIS를 이용한 도시홍수에 대한 지역안전도 평가”, 「한국지리정보학회지」, 14(3): 68-77. -
Yu, S.C. and Yeo, K.H., 2015. “Indicators and Activate about Urban Regeneration Corresponding Climate Change: Focusing on the Seoul Metropolitan City”, Journal of Korean Urban Management Association, 28(4): 77-99.
유선철·여관현, 2015. “기후변화에 대응한 도시재생 지표개발 및 활성화지역 선정 연구: 서울특별시 사례를 중심으로”, 「한국도시행정학보」, 28(4): 77-99.